Five Google Sheets formulas for HR managers


Table of Contents
Table of Contents
Beebole’s blog is home to some really great tutorials. Often, both Google Sheets and Office 365 experts dive into practical tutorials you can start implementing at work today. Whether you’re a financial controller looking to manage profits, an HR manager who wants the best for your team or someone who just wants to manage company data more efficiently, these tutorials are for you. We’ll be publishing these posts regularly, so don’t hesitate to let us know if there’s a topic you’d like to see covered.
If you work in Human Resources, your job might contain all of the following: employee time tracking, payroll, hiring, performance review, personnel issues, and so much more! With a job that changes every day, how do you make the most of your time?
Every job requires working with data. Using Google Sheets, you can manage and analyze data effectively. It’s a simple, free spreadsheet tool that’s good enough to analyze your workforce and their needs. In this tutorial, you’ll learn five formulas HR managers can use in Sheets to automate and expedite important tasks.
We’ve created a spreadsheet that you can use to practice the formulas and functions in this tutorial, which you can grab here:

With your copy of this spreadsheet, you can follow along and complete the exercises below before applying it to your job in HR. Beebole users can also take advantage of our free add-on for Google Sheets and access their timesheet data via Google spreadsheet in real time.
If you’re running a lean operation, chances are that you’re doing payroll in-house. For hourly employees, that means calculating and capturing the hours worked so that you pay your team accurately.
For each employee, it’s best to capture the hours they work by shift. On each spreadsheet row, log an employee’s time in and time out. Payable hours are the difference between the two times.
Now, find the difference between the two times by writing a simple subtraction. In this case, subtract the start time from the end time with a formula.
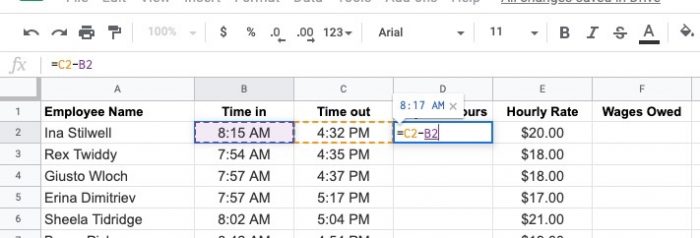
You’ll notice that Sheets returns an answer, but it’s not in the format that we need. Let’s use formatting options to convert it to a total number. On the formatting dropdown, choose the number option.
This number is basically a partial day. To convert it to a simple number of hours, multiply that number times 24 in the same cell.

That’s it! You’ve calculated their payable hours, and all that’s left is to multiply it by their hourly pay rate to find the wages owed. Now you’ve calculated base wages and are ready to prepare the payroll.

On a related note, you might also be interested in learning about payroll variance, and why it’s crucial to making smarter business decisions.
Compensation reviews are a must for every HR team. If your employees are paid out of line with the market or their peers, you risk losing top performers or inflating your labor costs.
Spreadsheet functions make understanding the true cost of employees and comp reviews easier. Let’s look at a few techniques that help you review and adjust compensation.
First, make sure to lay out your data in a structured format that makes it easier to review. Capture all of the data that can help you understand the employee’s compensation, like job title, years of service, performance rating, and any other info that helps you compare compensation.
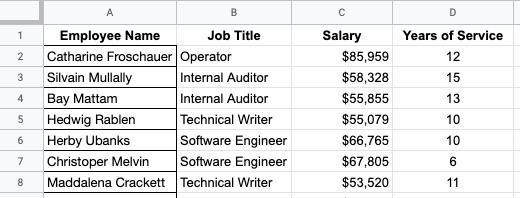
To review comp, you need to compare employees with similar job roles. That’s why it helps to use a function called AVERAGEIF, to average the salaries for a given job title. Let’s use the AVERAGEIF function to find the average for each job title.
First, start by creating a list of all job titles in your organization. Paste that list separately from your data. Now, let’s write an AVERAGEIF. The structure for AVERAGEIF is as follows:

Let’s walk through this. For the first part of the formula, you’ll want to highlight the job titles. Also, go ahead and press F4 on your keyboard to lock in the references to these cells. Then, add a comma to move on to the next part of the formula.
For the second part of the formula, you’ll want to enter the “condition” or basically the field you want to watch. Click on the first job title in the list you created. This is basically telling Sheets to use the selected job title for your AVERAGEIF.
One last step: add a comma, and then return to the comp data table. Highlight the numeric values, and press F4 again to lock in the references. Close your parenthesis, and press enter. Voila! You’ve found the average, but only for a specific job title.
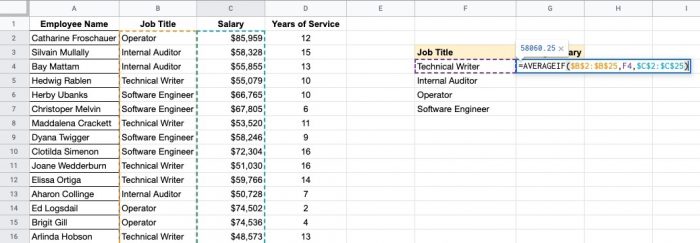
Best of all, you can simply pull the formula down to run the same calculation for each job title. Because we locked the data references (except for the titles in the list) the formula will extend perfectly.

That’s it! You have averages for each job title in your organization, and you can use it to review individual compensation plans to make sure that there are no outliers. If you found this tip helpful, don’t miss our tutorial on how to automate emails from Excel, which happens to be the easiest way to send employees their bonus emails!
Showing appreciation for employees is a key part of retaining them. Celebrating milestones and remembering their growth in your company shows that you care. That’s why it helps to calculate length of service.
This tip is a simple one. For each employee, you need to start with a spreadsheet that has each employee’s start date. Then, write a formula for today’s date using the TODAY function so that you have an always-up-to-date cell with current dates.

Sheets returns the number of days between two dates. If you want to convert this to year, you’ll need to convert it by dividing the result by 365.
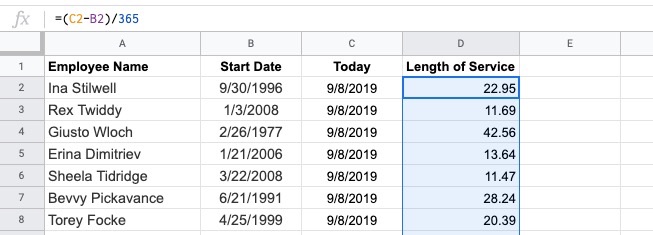
At the start of each month, open your spreadsheet and review the list to plan any upcoming celebrations. As you approach whole numbers in the “length of service” column, prepare celebrations for your team.
You don’t always have the luxury of “clean” data. Maybe your payroll system automatically joins first and last names into a single column. Or maybe a monthly report from your financial system puts employee names in all caps.
No matter what type of data you work with, every HR professional benefits from a few data cleanup techniques. Let’s learn more.
For our example, let’s assume that we get data in an ugly format like the one that you see in the screenshot below.
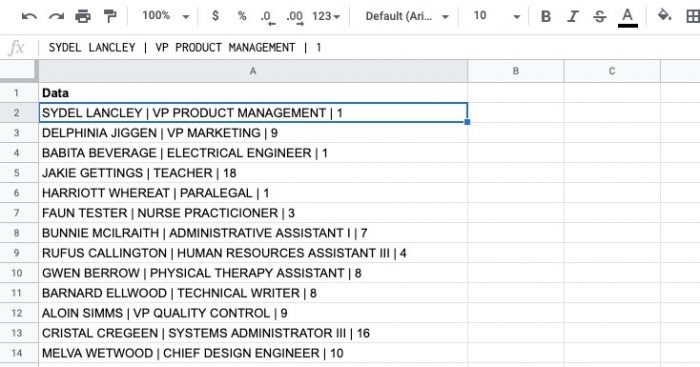
To split it, we need to separate it in columns each time you see the “ | ” character. Highlight the first column, then go to the Data > Split Text to Columns .option. Then, on the Separator dropdown, choose Custom and add the character that you want to split your text based on.
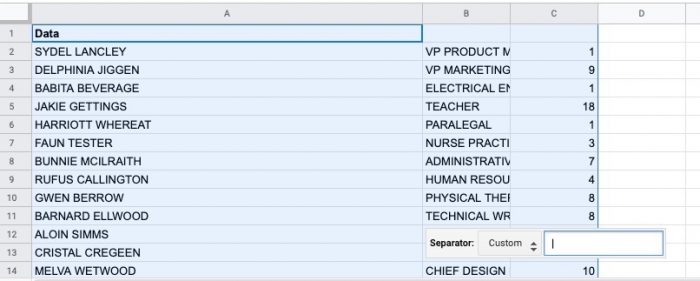
Now, Sheets will split the column every time there’s a “|” character. You could repeat this same set of steps to split full names into first and last names by choosing “space,” for example.
One other step to clean up data. Use the PROPER function to convert the all-caps text to a more naturally readable version. It’s not perfect (for example, you might need to retype “VP” instead of “Vp,” but it’s faster than re-typing from scratch.)

Rounding out our formulas, let’s learn how to calculate the net working days between two dates. This is another formula that you can use when calculating salaries or length of service. No matter how you use it, it helps you find the number of working days between two dates.
Use the function NETWORKDAYS to start calculating the working days. Naturally, this excludes weekends, so it’s ideal for your salaried workforce. Point it to two date cells, separated by commas.

You can also exclude holidays from your calculation. Add another comma, then highlight the list of holiday dates. You could type F4 on your keyboard to lock in the holiday references so that the formula extends naturally as you drag it.

That’s it! The result is a calculation for the total working days between dates.
In this article, you saw five techniques to help you work with data in Google Sheets. These techniques are designed to help you spend less time working with data, and more time engaging your workforce. If you enjoyed this post, don’t miss more great Google Sheets spreadsheet tips like how to automate employee cell phone data usage and how to perform an annual compensation review.
Ready to give it a try? Get a free 30-day trial with Beebole to get instant access to payroll, employee time tracking sheets, customizable reports and more. The best part? Use our Google Sheets add-on to take your HR data to the next level. Free for all our users.
—
Photo by @bkotynski on Unsplash
Managing a remote team comes with its own unique set of challenges. That’s exactly why we hosted this webinar on how to make remote work part of your team’s DNA, hosted by Laurel Farrer and featuring some of today’s top remote work experts. Watch the recording here, or keep reading to learn more. How to […]
Inaccurate time tracking costs companies money and chasing after late timesheets costs managers time. However, it is also easy to understand why employees forget or choose not to track their time. Without thoughtful onboarding and open communication, your employees are unlikely to track their time correctly or at all. Often, when this happens, companies end […]
Who is Alex Sotelo? Where: Open Education has its roots in Venezuela, where in 2002 CEO Andrés Moreno founded Optimal English. His goal was to provide English classes taught by native speakers to Latin American executives. Optimal English became Open English in 2008, with a shift to virtual classes available 24/7. 10 years later, Open […]
Spreadsheets, once synonymous with HR, have become unsustainable in the evolving world of work.
Hi Aaron,
Thanks so much for taking the time to read this article! While there certainly are a lot of great programs and BI tools available today, there’s no denying the beauty and ease of spreadsheets, especially when used and integrated correctly.