
Table of Contents
Want Better Project Time and Cost Insights?
Save 20% per month
20+ integrations
Permissions and customization
To deliver a product or service within a specified time and budget you have to juggle a variety of activities, responsibilities, and stakeholders. Estimating the project’s cost and keeping tabs on actual spending are two crucial aspects for project managers. Budget to actual variance analysis is the comparison of the budgeted and the actual cost of the project as it progresses.
What is a budget?
What is a budget?
A budget is a financial blueprint or a roadmap of how a project is expected to materialize over its lifetime. It provides a basis for monitoring and controlling project expenses.
Budgeting involves financial planning and creating an estimate of the associated project costs. That could include costs like materials, labor costs, equipment, and overhead and then comparing these estimates to the amount of funding available. This ensures the project can be completed within the available time and financial constraints.
Budget is also an essential tool for both project managers and finance teams to assess the financial viability of a project. It helps identify potential cost overruns before they occur. This ensures efficient and effective use of resources.
Example:
Let’s say we are working with a company in technology business operations among other high growth companies. And we are looking at a mobile application development project. We have a team of four people working on this project, including a project manager, a frontend developer, a backend developer, and a designer. Let’s say this is a six-month project.
We can do some rough financial modeling and come up with an estimate of the time each team member will spend on this project.

The hourly rate for each of the roles is as below:

By multiplying the estimated hours with the hourly rate, we come up with the budgeted cost for the project as below.

In the above example, the estimated or budgeted cost of the project is roughly ~$50K.
What are actual and budget to actual variance analysis?
Actual are the costs spent on a project as it progresses. It measures the real cost of the project. While doing the budget vs. actual variance analysis, we can then compare the budget to the real cost to see if the project is on track. In the above example, the team ultimately spent more time than anticipated on several roles.
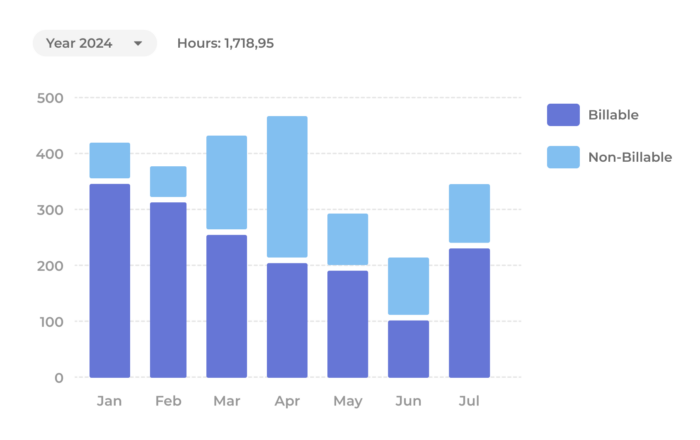
With Beebole you can capture the actuals with the final cost and compare that to what was originally planned. Incorporate this data directly into Excel or Google Sheets and you can easily tackle the budget vs. actual analysis.

Here are few reasons you might want to give it a try:
- Real-time access to your data.
- Easily use pivot tables, calculations, graphs, charts, VBA, and everything else the world of Excel has to offer.
- Integrate other tools with your timesheet data in Excel, such as Google Data, Power BI, BigQuery, SQL Server, Oracle, and many more.

Here are some of the benefits of syncing your time tracking data with this add-on:
- Take advantage of real-time analysis with Google Sheets’ capabilities like custom templates, pivot tables, calculations, Explore, Google AI, and more.
- Google Sheets makes collaboration easy. You can set permissions and collaborate with multiple teams in real time, including by adding comments, suggesting changes, and having a clear record of activity in reports.
- Set up automated emails with weekly reports to both colleagues and clients.
The presence of a time-tracking system like Beebole is crucial for any service company looking to streamline customer billing and cost control. It enables us to effectively manage income and expense budgets and monitor profitability at every operational level—company, client, project, and employee/contractor /vendor.

Budget to actual variance analysis comes in handy when you need to understand how or why your budget is off. For example: The hourly rates you’d budgeted for have changed. Instead of what was estimated above, take a look at what the real hourly rates turned out to be:

Next, let’s calculate the actual amount spent on the project at the end of the six months. By multiplying the actual hours with the actual rate, we get the actual cost for the project as shown below.

In the above example, the actual cost of the project is roughly ~$56.6K, which is obviously a different number than the budgeted $50k.
Confused by Budget Variances?
Beebole removes the guesswork, pinpointing exactly when and where things go off track.
What is a budget variance?
A budget variance is the difference between the budgeted amount and the actual amount. It is calculated by subtracting the budgeted amount from the actual amount. Depending on whether the actual numbers are higher or lower than the budgeted amount. It can be expressed as a positive or negative number.
- A positive variance indicates the actual spent was lower than the budgeted amount. This is a positive sign of financial performance.
- A negative variance indicates the actual amount spent was higher than the budgeted amount. This indicates under-performance and requires further investigation.
Whether positive variance or negative variance, it’s important to analyze the reasons for variances. This helps decision makers identify areas for improvement and better decision making for future budgeting.
Rancho BioSciences manages over 100+ simultaneous projects, and they faced major challenges with cost control and budget visibility while previously using spreadsheets. By implementing Beebole’s real-time tracking, budget monitoring, and customizable project views, they gained the visibility needed to:
🚀 Accurately track actual costs vs. budgeted estimates
🚀 Avoid project cost overruns
🚀 Improve invoicing and senior leadership reporting
🚀 Centralize data across teams and tools
“It sure beats spreadsheets. I love the snapshot views it gives me. I can log in and easily see the status of 130-140 active projects. I can easily see where they’re all at, and if I wanted to dig deep, you know, all the data is there.”
Why is budget vs. actuals important?
Accurate forecasting and tracking of budget vs. actual provides a clear picture of the financial performance of the project, the department, and organization as a whole. So what’s the difference between budgeting to forecasting? Budgeting involves planning and allocating resources for a specific period, while forecasting involves predicting future outcomes based on past data and current trends.
It allows project managers to identify and address any cost overruns or inefficiencies. This information also helps to make informed decisions to bring the project back on track. Accurate tracking also ensures that the project remains on schedule and within budget. Plus, it also helps to find cost savings and resource optimization opportunities, which is obviously critical for any project managers or finance teams using this information.
Let’s take a deeper look at why understanding your budget vs. actuals is important:
1. It provides a clear forecast of the financial performance of a project.
This is critical for stakeholders, as it helps assess the financial viability of the project. It also makes room for informed decisions about future projects. The analysis allows project managers to find patterns and trends in the actual costs. They can then make more accurate cost estimates for future projects.
2. It helps to identify any variances in the project costs.
Variances are an equally important indicator of project performance. It helps identify areas where the project is underperforming or over-performing. This data or information allows project managers to make informed decisions about how the project can be adapted to meet the budget and cash flow.
3. It facilitates stakeholder communication.
By providing stakeholders with accurate and up-to-date information about project finances, project managers and finance teams can build trust and confidence with their team, sponsors, and other stakeholders.
How do you calculate the variance?
The formula for variance in budget vs. actual depends on the context and the data or information being analyzed. Variance in budget versus actual refers to the difference between the budgeted amount and the actual amount spent in a given period. And it can be used to assess performance and identify areas where adjustments may be needed.
Variance = Actual amount – Budgeted amount
Continuing with our example, here is a snapshot of actuals vs. budget variance analysis:
We had estimated about 570 hours of time and $5,100 as the total projected cost of the project. Turns out we ended up spending 635 hours and $56,640. That means that we overran our initial estimate by 65 hours and $6,500.

Let’s analyze budget vs. actual to figure out what caused this overrun:
- More time spent by backend developer and product designer

Overall, the backend developer ended up spending 360 hours on the project vs. the 300 hours estimated. Similarly, the product designer spent 85 hours vs. the budgeted 60 hours.
- Higher hourly rate for the Project Manager and Product Designer
Here are the budgeted hourly rates that were uploaded in Beebole.

And here are the actual hourly rates that were logged in Beebole.

We ended up paying $160/hour to the project manager vs. $150/hour in the budget. Similarly, for the project manager we spent $120/hour vs. the $100/hour in the budget.
Budget variance types (Examples)
To explain the variances, one can break it down into two components: Rate and Volume. Let’s have a deeper look:
1. Rate variance:
This reflects the difference between the actual cost or actual revenue per unit and the budgeted cost or revenue per unit. The formula for price variance is:
Rate variance Formula = (Actual Rate – Budgeted Rate) x Actual Time spent

2. Volume variance:
This reflects the difference between the actual time and the budgeted time. The formula for volume variance is:
Volume variance Formula = (Actual Time – Budgeted Time) x Budgeted Rate

Of the $6,500 total variance, the difference of $2,450 results from a change in the rate ($/hr). While the remaining $4,050 is the result of more time spent on the project.
Next let’s take a look at how to prepare an Actual to Budget Variance analysis report.
Best practice step-by-step guide to preparing an actual vs. budget variance analysis report
A budget variance analysis report follows a standard structure, including the following:
- An introduction
- Budget vs. actuals report: A summary of the budget and actual results
- A breakdown of the variances
- Variance analysis in Budgeting: Detailed analysis of the variance
- Recommendations for action
- Conclusion
- Appendix and Financial Statements
Introduction
Start your budget variance report with a brief introduction of the findings and its purpose. It should explain what the report is about and why it matters.
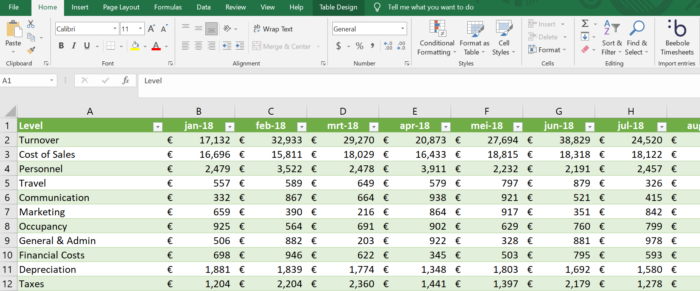
Budget vs. actual report: Summary of budget to actuals expenses
The summary provides an overview of the budgeted amounts and the actual results.

It includes the budget amount and actual expenses for each line item, as well as the percentage variances. We can use tables or graphs to present the information in a clear and concise way.
Variance breakdown
This section breaks down the variances into its components.

This could be price variance, quantity variance, mix variance, and volume variance. Again, try using tables or graphs to present the information.
Variance analysis in budgeting: Budget variance analysis
Here we analyze the variance to identify the factors that contributed to the difference. We also determine the reasons for the variance, like whether the variance is favorable budget variance or unfavorable budget variance. Provide supporting evidence and examples to illustrate your analysis.
Recommendations for action
Based on the analysis, we can provide recommendations for action to address the variances. This is a chance to identify specific actions that can be taken to improve performance or specify anything else that can be done to achieve better results in the future. We explain how each recommendation can close the gap between budgeted and actual amounts.
How Beebole can help with reporting and analysis
Beebole’s Google Sheets integration is the winner for us. I love that you can easily integrate with Sheets; it makes my reporting an absolute breeze. Two clicks and the latest data is imported and ready for interrogation; it makes Beebole a really powerful tool.
I generate several reports to look at timesheet data and easily export them to Excel.
I can’t say enough about how easy and effective Beebole is for tracking time on projects. It is incredibly powerful yet simple to use. No one wants a “solution” that takes more time than the time-saving it is supposed to provide. For tracking projects and different scopes within a project, this is the easiest and most efficient use of my time. It gives us accurate and detailed information to include with client billing.
Conclusion
Finally, here we summarize the key points of the report. Also, we emphasize the importance of taking action to improve performance. And provide a clear call to action and encourage stakeholders to implement the recommendations.
Appendices
These include any supporting information, such as tables, graphs, or detailed calculations and financial statements. It specifies instructions on how often to run a Budget to Actuals report, and it also shares guidelines and tips on Budget vs. actuals: how to control variance.
The appendices should be well-organized and easy to understand. When writing the report, we must keep in mind the audience and their expertise level. We should also use clear and concise language, and avoid technical jargon (unless it is absolutely necessary.) Don’t forget that the use of visuals, such as tables and graphs, helps explain complex information. Finally, proofread the report carefully to ensure it is error-free and well-structured.
Final thoughts on budget to actuals variance analysis
We hope that after reading this article you feel well-versed in the differences between budgets and actuals, and what a budget vs. actual variance is. Furthermore, we hope you can take that information and not only understand when it’s favorable and unfavorable variances. But how to present this information to stakeholders, finance teams, and more.
Budget to actual analysis is a critical aspect of the project management team. It helps project managers assess the financial viability of their projects and control fixed costs and variable costs by monitoring and analyzing expense variances between actual and budgeted costs. When done properly and efficiently, project managers can identify inefficiencies, make necessary adjustments, and ensure project success.

—
Photo by firmbee.com on Unsplash
The experts who have written or contributed to this article are independent from Beebole, and their contribution doesn't serve as endorsement for our company/tool or their past/present organizations, employers, or associates.

Asif Masani is the author of the book "All About FP&A." He is on a mission to help one million finance professionals master FP&A skills. He has 12 years of experience across banking, pharma, and EdTech. He leads the India and APAC FP&A function at Coursera and is a Chartered Accountant (from India) by qualification. He likes teaching FP&A skills as a guest faculty member at many Indian institutes. He is also a regular blogger and contributor at FP&A Trends and FP&A Professionals.
Related posts

Learning from failure: A complete guide to modern project post-mortem analysis
In today’s fast-paced business environment, the difference between organizations that thrive and those that merely survive isn’t found in their ability to avoid failure—it’s in their capacity to learn from it. That’s why we’re tackling project post-mortems and everything you need to know to conduct them successfully. TL;DR: What you’ll learnThis article explores how modern project […]
Mastering budget vs. actuals analysis: Excel Power Query tutorial + FREE template
In this tutorial, learn how to create a budget vs. actuals report in Excel using Power Query. Gain insights and track financial performance effortlessly. As a financial controller, accountant, or CFO, you’re likely familiar with the concept of budget vs. actuals. You know that reporting budget vs. actuals can be both cumbersome and time-consuming, given […]
The 14 best time tracking tools to track billable hours for projects
Time tracking tools to track billable hours have become indispensable assets for operations and finance managers seeking to optimize profitability and maintain precise project cost control. By accurately capturing the time spent on various tasks and projects, these applications provide helpful information for workflow efficiency, resource allocation, and billing accuracy. Also, they eliminate the guesswork and potential errors associated with manual time […]