

Table of Contents
Like our content?
Prefer us on Google.
Add as preferred Prefer us on Google.
source on Google
Beebole is a key staple of our back office operations.

There are three words that have transformed business intelligence (BI) into one of today’s most popular topics: data, data and data! That’s right. Not too long ago, the most important decisions of a company were defined by accumulated experiences and intuition. Today, however, effective management is defined by actionable, data-driven information.
Gone are the days when companies struggled with a lack of data. Nowadays, they are overwhelmed by it. If you feel lost in the amount of data your company is collecting, it may be the right time for you to start thinking about a business intelligence solution.
TL;DR: What you’ll learn
Business intelligence turns the data your company is already drowning in into decisions you can actually act on. We’re here to show you what it is, how it works, and which tools can help.
This article covers:
- What BI actually means: The process (and the “data mining” behind it) that turns raw, scattered data into insights your team can use
- Why it’s worth the investment: From faster, more confident decisions to catching inefficiencies and trends before competitors do
- The tools and jargon, demystified: Dashboards, OLAP, self-service BI, ETL, and the rest of the glossary, explained in plain language
- 10 of the top BI tools on the market: Including Beebole, Power BI, Tableau, and Qlik, with real pros, cons, and customer case studies where applicable
- What BI looks like in the real world: Examples from a non-profit museum and a retail business show the same principles playing out in very different settings
- Where time-tracking data fits in: How project time, resource, and financial data can double as a built-in BI engine, without buying a separate analytics tool
What is business intelligence?
Business intelligence: The definition
Business intelligence (BI) is a group of tools, methods, and programs that are designed to collect, analyze and transform data into valuable information (insights) that companies can use to make better decisions and optimize their businesses.
Technically speaking, the process of collecting, analyzing, and transforming raw data into valuable information is called “data mining”. In this way, data mining enables business intelligence by decoding and transforming raw, unstructured data into easy-to-digest information that BI teams can use to derive meaningful business insights.
Considering the above, business intelligence empowers data-driven decisions that allow companies to identify inefficient processes, find patterns and trends, adapt with ease to changes in their markets, and implement solid business strategies. In other words, BI empowers the business decision-making process.

What else can business intelligence do?
Apart from improving your decision-making processes, there are many powerful reasons that justify an investment in this kind of technology. Let’s see how BI can help you run a smart company.
Business intelligence can:
- Help you make sense of the data your business collects.
- Uncover and reveal problems, patterns, and opportunities.
- Improve your forecasting and tracking processes.
- Optimize your business operations.
- Help you move faster and more accurately.
- Enable users to generate actionable business insights.
- Allow you to stay competitive in the market.
- Save you money and eliminate inefficiencies.
- Create a common vision for everybody in the organization.
While these advantages are general, business intelligence addresses different areas in very specific ways. Let’s see how business intelligence software improves the following key business areas:
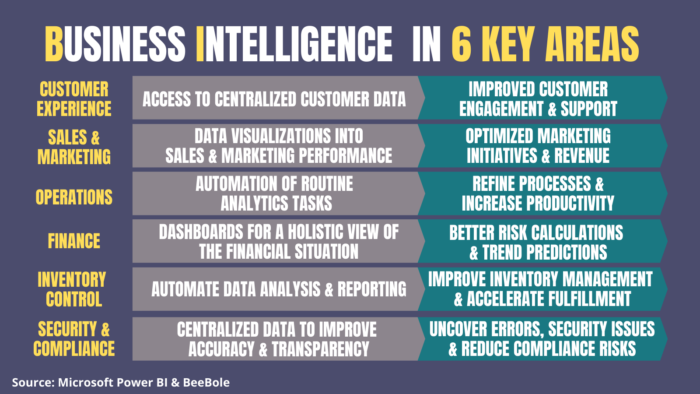
But what kinds of tools, methods, and programs are used to collect, analyze, and transform data into valuable business information? Let’s take a look at some of the most popular and powerful business intelligence technologies in the market.
BI tools: An overview
Generally speaking, when we talk about business intelligence tools or business intelligence software, we are talking about tools that allow companies to create value from big data. Let’s get familiar with the variety of BI software available in the market. The following list provides an overview of the kind of technology and business intelligence solutions provided by today’s top BI tools:
- Digital dashboards
- Data visualization software
- Reporting and querying software
- Online Analytical Processing (OLAP) tools
- Self-service business intelligence
- Cloud / SaaS / business intelligence software
- Mobile BI software
- Embedded BI software
- ETL (extract, transform, and load) software
- Self-service data preparation software
- Data mining tools
- Data warehousing tools
- Decision intelligence
- Business performance management
- Unified Modeling Language
- Local information systems
While some of this technology is self-explanatory, we anticipate that a few of the terms we just mentioned may be new for you. Because of this, we would like to clarify some of them with the following brief glossary.
Business intelligence glossary
- Cloud / SaaS / BI Software: A delivery model that allows companies to use business intelligence tools without the need for installing, operating, and/or maintaining such tools on site. This technology is usually a subscription-based service.
- Data mining: A process aimed at discovering and extracting patterns from large amounts of data.
- Data warehousing: A process of putting together and organizing big sets of data into one common place.
- Embedded BI software: A process that incorporates BI software features such as data visualizations and dashboard reporting into an application.
- ETL software: Software used to combine, clean, and profile data from various sources.
- OLAP: Software that enables multidimensional analysis at high speeds on large volumes of data.
- Self-service business intelligence: An approach that allows business users to access and analyze data without the support of IT experts.
- Self-service data preparation software: Software that allows businesses to prepare and clean data without the need for IT support.
- Unified Modeling Language: A visual language that is used by IT experts to define the behavior and structure of a system.
It’s important to note that most of the tools we are about to discuss in the next section combine several of the features we’ve highlighted. For instance, a platform such as Microsoft Power BI offers dashboards, reporting software, and mobile BI software, among other business intelligence capabilities.
Let’s see what the most important business intelligence features and tools are in the market.
What are the main steps to implement BI?
Before we talk about features and tools, it is important to understand how business intelligence implementation works. To do that, we’ll use the five-step process described in TechTarget’s guide to business intelligence. Once data from different source systems has been integrated, cleansed, and stored, usually in a data warehouse, the main steps of a business intelligence process are:
- Teams prepare the data: they organize, transform, and model it for analysis.
- Business users or BI professionals run queries against the prepared data.
- The results become data visualizations, reports, and dashboards that show KPIs and other findings.
- The BI team, or self-service users, share the results with decision-makers.
- Decision-makers use the metrics and insights to inform business decisions.
Now that we know how BI works, it is time to see the kinds of functions and features that business intelligence technology provides to companies.
What do business intelligence tools do?
When it comes to features and functions, business intelligence technology is quite generous.
Most BI tools share a core set of features. As Capterra’s guide to the benefits of BI puts it, they connect multiple data sources, let non-technical team members build reports with drag-and-drop dashboards, and give access to real-time reports. Here are the features you’ll find in BI software, from the basics to the more advanced ones:
- Data analysis and analytics
- Ad hoc reports
- Dashboards
- Performance metrics
- Data visualization
- Ad hoc query
- Ad hoc analysis
- KPIs
- Budgeting & forecasting
- Benchmarking
- Profitability analysis
- Trend/Problem indicators
- Strategic planning
- OLAP
- Predictive analytics
A SelectHub survey of more than 600 businesses looking for BI software found that most want the basic features, such as reporting and dashboards: 90% named dashboarding as a key feature, and 81% mentioned visualizations.
The basics matter even more for small businesses, which are short on time and rarely have analysts on staff. A 2018 Capterra article on business intelligence features for small businesses named three essentials:
- Dashboards
- KPIs
- Ad hoc queries
TechTarget’s guide lists the following as the major functions that BI platforms support:
- Business monitoring and measurement
- Data analysis
- Reporting and information delivery
- Predictive analysis
But which BI tools offer those kinds of features? What are some of the most popular business intelligence systems in the market? Let’s take a look.
Examples of BI tools
When it comes to business intelligence trends, the enormous growth of business intelligence systems is by far one of the most significant ones. This may be intimidating when you are trying to choose the right tool for your organization. However, this dramatic increase has come together with lower software costs, which have favored the adoption of BI tools across all kinds of organizations.
Every year, Gartner publishes the “Magic Quadrant for Analytics and Business Intelligence Platforms,” a report that ranks the main BI platforms on the market. In the June 2026 edition, the Leaders include Microsoft, Salesforce (Tableau), Google (Looker), Qlik, and ThoughtSpot. You can read the summary of the 2026 report on Gartner’s site.
The following list covers some of the most popular BI tools on the market and their key features:
- Microsoft Power BI (data preparation, visual-based data discovery, interactive dashboards, business analytics solutions).
- Tableau (data visualization, business analytics solutions, dashboards).
- Qlik (data analysis, data integration, augmented analytics, dashboards).
- Google (Looker) (data analytics, reporting, dashboards).
- Strategy One, formerly MicroStrategy (customized dashboards, data analytics tools, reporting).
- Domo (data visualizations, dashboards).
- Spotfire, formerly TIBCO Spotfire (analytics in dashboards, interactive visualization, data preparation).
- Oracle (data ingestion, augmented analytics, visualizations, dashboards, reporting, mobility).
- IBM (business analytics, enterprise reporting, data visualization).
- Sisense (business analytics, data visualization).
Note that we’ll cover many of these tools in-depth below.
What are the main outcomes of using BI software?
Companies use BI tools for a wide range of tasks, including:
- Analyze customer behavior, buying patterns, and sales trends
- Measure, track, and predict sales and financial performance
- Budgeting and financial planning and forecasting
- Track the performance of marketing campaigns
- Optimize processes and operational performance
- Improve delivery and supply chain effectiveness
- Implement web and e-commerce business analytics
- Measure customer relationship management
- Carry out risk and strategic value driver analysis
Evidently, the way business intelligence is used depends a lot on the kind of companies or industries we are looking at. In the following image, we can see how certain industries apply business intelligence in order to reach some very specific goals.

Business intelligence’s impact isn’t limited to the corporate world. It’s also become a powerful tool for tackling some of society’s biggest challenges.
When it comes to combating hunger, for example, Feeding America, the largest hunger-relief organization in the United States, has partnered with the Tableau Foundation since 2015. It built a data warehouse that collects data from its food banks every day, with Tableau on top, so the national office and each food bank can make data-driven decisions. “[Tableau] allows us to provide better support to food banks. It also allows us—as a whole network—to advance our analytics to provide more in-depth and more flexible analysis to the different kinds of questions people across the network might be asking about the work we’re doing,” explained Stephanie Zidek, now Vice President of Data & Analytics at Feeding America, at Tableau Conference 2021.
10 best business intelligence tools and solutions
Choosing the right business intelligence software depends on your business’s specific needs. Are you looking for interactive data visualizations, or a tool built for detailed financial analysis?
While needs vary, some BI tools stand out for working well across a wide range of industries. Below, we cover the top 10, each with a short introduction and its pros and cons, and most with a real-world case study.
1. Beebole
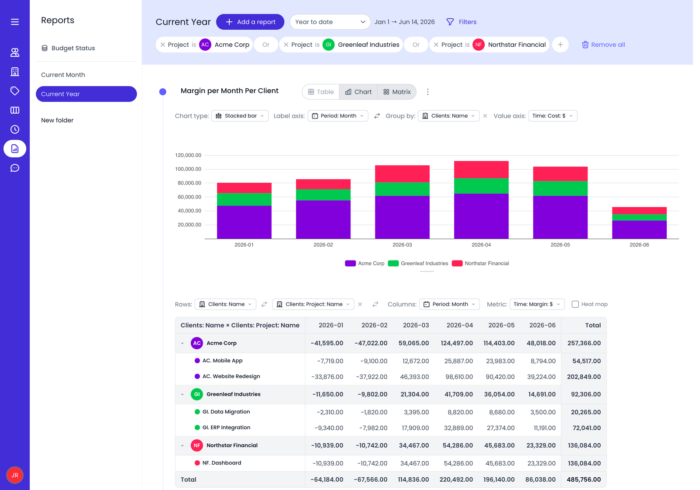
Beebole’s project time tracking does more than log hours: it doubles as a business intelligence layer for your projects. Build multidimensional reports on time, billing, costs, and margins, save them in folders you can share with your team, and switch between tables and 11 chart types to find the story in the data. Beebole’s project financials turn tracked hours into real-time budget-to-actuals comparisons and profitability reports. The planned vs. real report compares planned and logged time in hours, billing, cost, or margin, carries a forecast forward from today’s actuals, and tells you whether each project is behind, on track, or ahead. The staffing view shows each person’s workload and remaining capacity, so overbooking shows up in the plan before the work starts. All of this runs off the same timesheet data, with no separate BI tool to set up.
If you’d rather not build a report yourself, type what you need in plain language under Ask for a report. Beebole creates the report, saves it, and runs it, with a chart if you ask for one, and Beebole’s own reporting engine calculates the numbers, not the AI model. You can also connect Claude or ChatGPT to Beebole through its MCP server, with exactly your own permissions, and ask the assistant to run your saved reports.
Pros:
- Combines time tracking, resource planning, and financials in one tool, with no exporting to separate systems for BI reporting
- An Excel add-in and a Google Sheets add-on keep a spreadsheet linked to a saved Beebole report and refresh it on demand
- Download any report as CSV, Excel, or PDF, or pull the data into other BI tools through the API, included on every plan
- Simple and intuitive
- Track time on your phone, approve timesheets, and read reports, from an app you install through the browser
- Free plan for up to 5 users, and a 30-day free trial of every feature with no credit card
Cons:
- Building and configuring reports works best on a larger screen; on a phone, reports are for reading and filtering
- Costs, margins, and budgets need the Advanced plan, or Essential with the Costs, Expenses & Budgets add-on
The Cloud Perspective, a UK-based data consultancy, needed a way to turn raw operational data into business intelligence it could act on. With Beebole’s reporting and export features, the team can:
🚀 Turn time tracking data into BI-ready reports and KPIs
🚀 Analyze productivity at both the individual and company-wide level
🚀 Export raw data for deeper analysis in other BI tools
🚀 See costs, profitability, and resource allocation in real time
The Cloud Perspective case:
This data consultancy has been using Beebole to record the working time of its consultants. However, Beebole’s impact on the organization has gone far beyond that. “I love the ability to look at the productivity of individuals or the entire business, and the fact that the data is readily available in graphs, tables, charts, etc. And that through the export and API I can download the raw data for analysis,” states Miranda Pocock, founder of the company.
Project Time Tracking Data for Better Business Intelligence
2. Microsoft Power BI
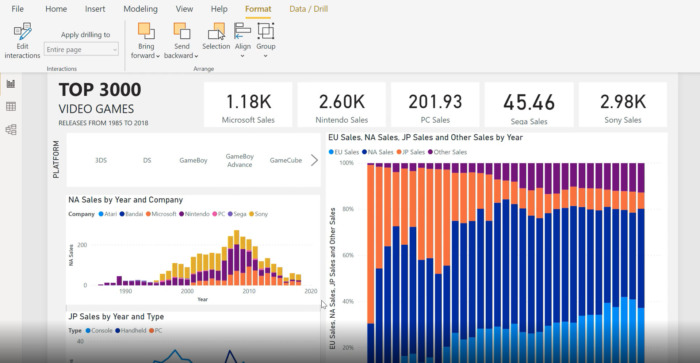
If your team already works in Microsoft 365 and Excel, Power BI is one of the BI tools to consider. It is now part of Microsoft Fabric, Microsoft’s analytics platform.
Microsoft Power BI offers data preparation, visual-based data discovery, interactive business dashboards, and augmented analytics. Power BI can also support tasks like planning and budgeting. Apart from that, one of its distinctive advantages is that this BI tool is available both as a SaaS option (via the Azure cloud) or as an on-premises option.
Pros:
- Strong visualizations, including real-time dashboards
- Integrated with Microsoft products
- Access on web and mobile devices
- Free version, with Pro at $14 and Premium Per User at $24 per user per month, paid yearly
Cons:
- The on-premises offering doesn’t provide the business intelligence capabilities of the cloud solution.

3. Qlik Sense
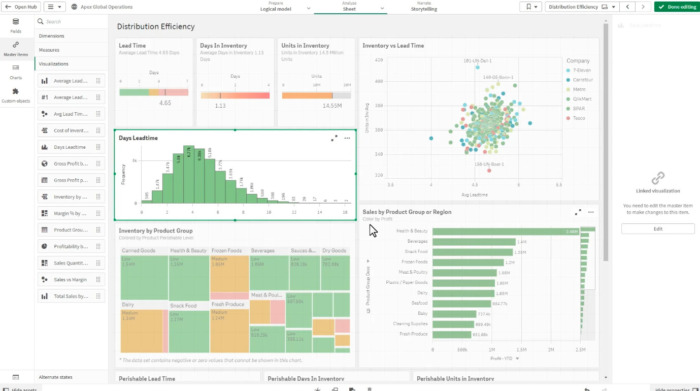
Qlik Sense is Qlik’s data visualization and discovery product, now part of Qlik Cloud Analytics. It includes Qlik Answers, an AI question-and-answer feature built into Qlik Cloud.
Pros:
- Interactive visualizations and dashboards
- Connects and combines hundreds of data sources with standard connectors
Cons:
- From $300 per month for 10 users, billed annually
4. Looker
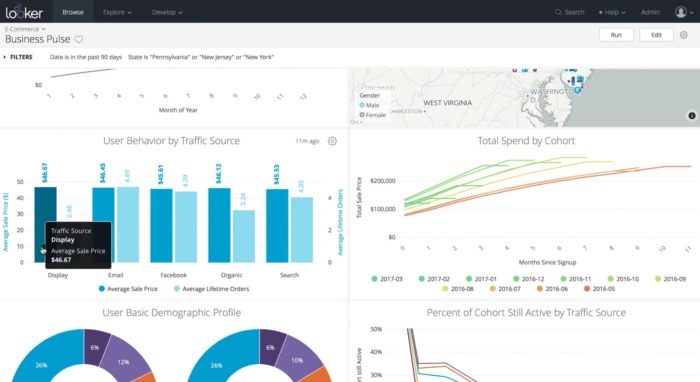
Looker is Google Cloud’s business intelligence platform, with self-serve analysis, data exploration, and dashboards. Google also offers Data Studio (formerly Looker Studio), a separate and simpler reporting tool.
Pros:
- Self-serve analysis, data exploration, and dashboards in one interface
Cons:
- Data modeling (LookML) is built for technical users
- AI features (Conversational Analytics, powered by Gemini) are billed separately
- Pricing on request for its Standard, Enterprise, and Embed editions
5. Tableau
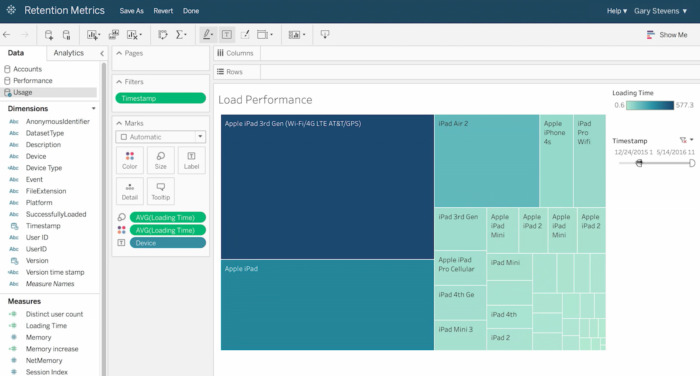
Tableau is Salesforce’s analytics platform for visualizations, dashboards, and reports. Salesforce has also added Tableau Next, which it describes as “an agentic analytics platform built in Salesforce.”
Pros:
- Great flexibility in terms of visualizations
- Intuitive interface
- On-premises, cloud, and hosted options
Cons:
- Standard starts at $15 and Enterprise at $35 per user per month, billed annually; the editions that include Tableau Next are priced on request
- Self-hosted Tableau Server is installed and managed in-house; the hosted option is Tableau Cloud
The Allrecipes case:
As the world’s largest digital food brand with a community of 85 million home cooks worldwide, Allrecipes knows how important it is to manage data properly. Thanks to Tableau, “Allrecipes can understand every stage of the customer journey. From analyzing web analytics to tracking content engagement, visual analysis allows them to spot and stay on top of emerging trends. Visibility into customer and web analytics helps Allrecipes reach dominant audiences like millennials, establishing a competitive advantage in the digital landscape.”
6. Tibco Spotfire
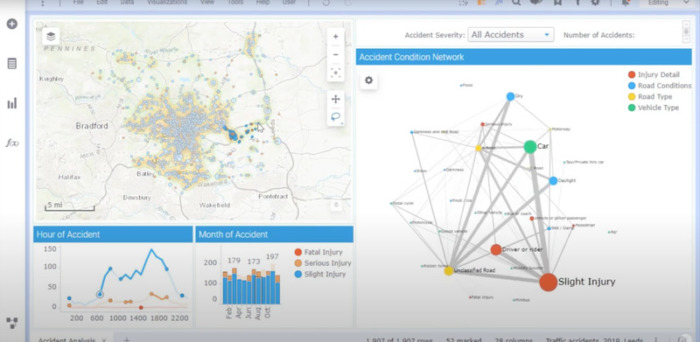
Spotfire, formerly TIBCO Spotfire and now part of Cloud Software Group, is a visual analytics platform for data-heavy teams that need advanced analytics.
Pros:
- Suited to advanced analytics and complex data models
- Scripting in IronPython, with full access to the Spotfire API
Cons:
- Spotfire Analytics costs $3,000 per user per year, excluding tax; Industry Pro is priced on request
The Aeroporti di Roma case:
Aeroporti di Roma, which runs Rome’s Fiumicino and Ciampino airports, built its operations control room on the TIBCO Connected Intelligence platform, with interactive visual analytics dashboards for airlines, handlers, security, and other stakeholders. During the pandemic, its analysis of which areas of the airport should stay open and which should close helped cut nearly 40 percent of its day-to-day operating costs, according to TIBCO.
7. Strategy (formerly MicroStrategy)
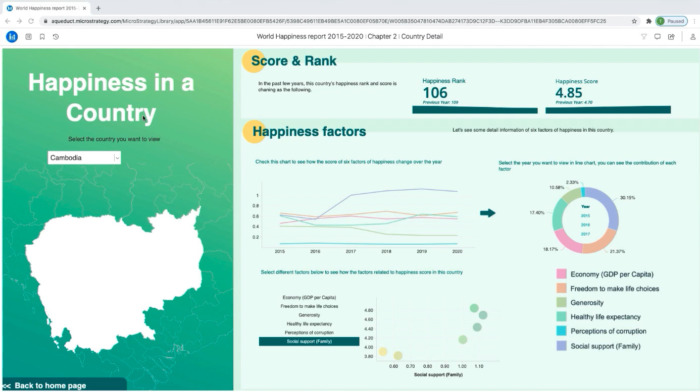
Strategy One, the analytics platform formerly known as MicroStrategy, lets users build self-service dashboards, create highly formatted reports, and run in-depth data analysis. It also supports data mining.
Pros:
- Data mining services to forecast future outcomes from your data
- Auto Answers, a chatbot in your dashboards that interprets business questions in natural language
- Auto Narratives, which turn complex visualizations into plain-language summaries
Cons:
- The Standard plan is for teams of 50 to 300 users, from $13 per user per month; Enterprise and Government plans are priced on request
- On the Standard plan, in-memory data is capped at 150 GB, and a high-availability setup, a dedicated customer success team, and customizable AI agents need Enterprise
The Pfizer case:
Pfizer’s field teams in 27 countries relied on static reports spread across several BI tools. With Strategy’s governed semantic layer, Pfizer built one global reporting solution, where leadership and field reporting share the same business rules and KPIs. Report utilization reached 90%, up from 10% across its legacy reports. “At Pfizer, we went from hours to minutes to seconds to be able to generate insights,” says Joseph Simrany, Director of Integrated Insights & Strategy at Pfizer.
8. Sisense
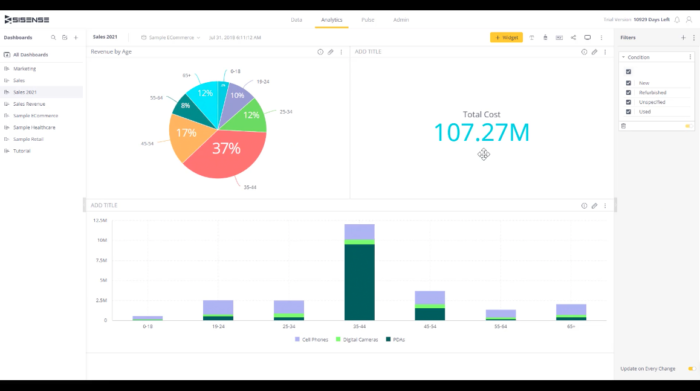
Sisense is an AI-powered analytics platform built mainly for embedding dashboards and analytics inside other software. It connects to multiple data sources, and its capabilities include data preparation, visual exploration, and Simply Ask, its natural language query feature.
Pros:
- Built to embed analytics inside other applications
- Natural language queries with Simply Ask
- Self-hosted on AWS, Azure, or Google Cloud, or hosted by Sisense on AWS
Cons:
- No published pricing; quotes on request
The CTSI case:
Every day, CTSI, a freight audit and payment services provider, processes between two and four million freight invoices. Because of that, CTSI was looking for a business intelligence tool that was able to provide its customers with a good view of their transactions. They opted for Sisense because of how easy it is to implement and embed in their TMS application. Plus, customers on a higher membership plan can design their own dashboards, providing CTSI with valuable information regarding its own customers.
9. Domo
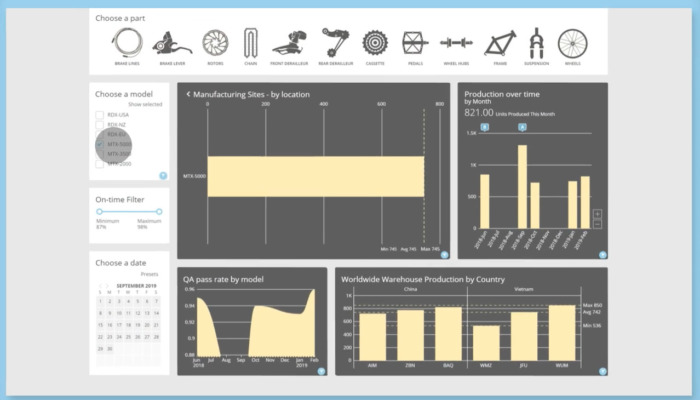
Domo is a self-service, cloud-based business intelligence platform, now part of Progress Software. Its capabilities range from data connectors and ETL (Magic ETL) to visualizations, dashboards, and custom apps built with App Studio.
Pros:
- Self-service analysis for business users
- Prebuilt connectors to popular business applications
Cons:
- Credit-based pricing with no published price list
The Traveloka case:
Like many businesses, Traveloka, a Southeast Asian app for booking travel, was heavily hit by the pandemic. However, that didn’t mean that work slowed down. On the contrary, the team was busier than ever trying to cope with cancelations, refunds, and reschedules.
At this particular moment, the company used Domo to track key customer metrics, balance the workload of various teams across the organization, and carry out contribution and cluster analysis. “Domo helped us manage a 10x increase in traffic to our customer care team by balancing workload across all teams in all countries,” said Gumarus Dharmawan William, Traveloka’s Product Manager.
10. Yellowfin
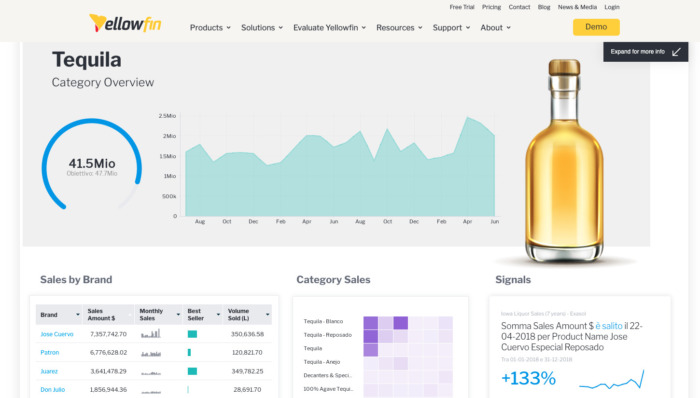
Yellowfin is an embedded analytics and BI suite. Originally conceived as reporting and data visualization software, it has expanded into data preparation (Yellowfin Data Prep) and automated analysis with Signals, which runs in the background to surface relevant insights.
Pros:
- Automated insights (Signals) and data preparation in one suite
- Wide range of functionality
Cons:
- No published prices: embedded analytics is priced per unit of usage, as a revenue share, or by server core, with quotes on request
The University of Konstanz case:
The University of Konstanz once ran its reporting on a paper and Excel based workflow. That changed with Yellowfin, whose “intuitive BI solution has enabled a broad range of academic and business decision-makers to access and independently analyze a single reliable source of data – anywhere, anytime from any device.”
The tools we just reviewed are among the best-known BI software available, but many others may fit your goals and your business. For a longer list, see BI consultant Donald Farmer’s roundup of 20 top business intelligence tools for TechTarget, published in December 2024, which covers the platforms he rates as the most significant for the breadth and depth of their features.
There are many powerful BI solutions on the market nowadays. Choosing the right one will depend on the needs of your business. Remember that the question is no longer whether or not to use a business intelligence tool, but rather which BI tool is right for your organization. If you truly want to transform raw data into gold, you need to answer that question with the best business intelligence software for your organization.
More real-life examples of business intelligence
In order to see the practical side of it, we would like to wrap up this article with a couple of examples where you can see the impact that business intelligence can have in different fields and organizations.
In the non-profit field
Because of the funding they receive, non-profit organizations need to be very effective in terms of accountability and transparency. In this example, the Kentucky Museum of Art and Craft, a non-profit organization, decides to effectively track all the activities it runs. To do that, they brought Beebole, a timesheet system with BI capabilities, into their business operations.
Thanks to this system, the organization can accurately track the time of all its staff and, thus, the time and true cost associated with each one of the activities it runs. With this BI solution, the organization is able to improve its decision processes and manage its budget effectively.
If you want to have more insights from this real-world example, we invite you to check out our interview with Aldy Milliken, Director of the Kentucky Museum of Art and Craft.
In the retail sector
Let’s imagine you have a clothing store that has both physical and virtual shops: your business offers a membership card, which users must use every time they buy something from your stores and/or e-commerce platform. Each time a customer uses his/her card, your system collects data about that particular customer and his/her transaction.
There are thousands of transactions taking place in your shops, and the amount of business data collected in your system is enormous. At this point, you decide it is time to bring a business intelligence (BI) solution into your business.
Thanks to business intelligence, you are able to run analytical reports on all the data you have collected from your customers. As a result, you can understand several things, including the following:
- The level of loyalty of your customers.
- The most popular products in your stores.
- How frequently customers buy products from you.
- Their preference in terms of physical vs. online shopping.
With this kind of information in your hands, you can understand or even predict your customers’ needs, preferences, and habits. You can also anticipate new opportunities, deliver better customer service, and optimize your marketing campaigns.
In other words, your business intelligence solution provides you with valuable insights regarding your customer’s historical transactions and behaviors, something you can use to improve your services, increase your sales, and differentiate your brand.
It’s all about this: Business intelligence insights
We have covered some of the specific things companies can do with their business intelligence tools. However, from a broader perspective, the ultimate goal of business intelligence is that of helping companies to make well-informed, data-driven, strategic business decisions. When companies can do that, they can enjoy the following benefits:
- Take control of the business data generated by the company
- Answer specific business questions effectively
- Improve decision-making processes
- Identify inefficient processes within the organization and improve business knowledge
- Gain a better understanding of business operations and challenges
- Increase productivity
- Identify market trends and opportunities
- Implement strong business strategies
- Boost sales and revenues
- Gain market advantage
As you can see, business intelligence technology is a powerful ingredient of today’s corporate world and beyond. If your business manages lots of data, but you are not making anything out of it, it may be the right time to implement a business intelligence strategy in your organization.
Photos: Beebole
The experts who have written or contributed to this article are independent from Beebole, and their contribution doesn't serve as endorsement for our company/tool or their past/present organizations, employers, or associates.

Writer specialized in finance, tech and SaaS. Apart from writing, he loves football and cultural walks around Rome.
Comments are closed.
Related posts

Why documenting your processes is key to surviving as remote business
You might think that process documentation—internally used, detailed descriptions with exact steps of how things are done—are complicated, time consuming, and unnecessary. You have far more important things to worry about when running a remote business, after all. Well, what if I told you that companies lose up to 30% in revenue every year due […]
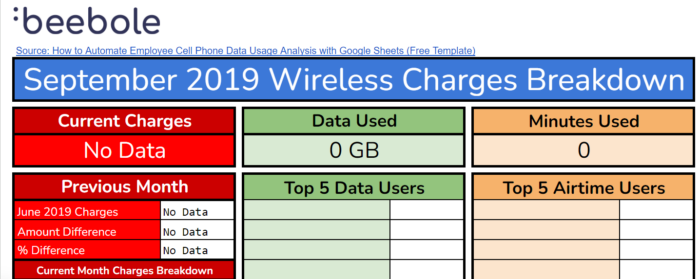
How to automate employee cell phone data usage analysis with Google Sheets (Free template)
There’s no arguing the importance of having a good handle on your employee cell phone data usage, nor the many pros to issuing devices to employees. A company-issued cell phone is often a win-win for both employees and businesses. It provides a clear line of division between work and play for employees, and is especially […]
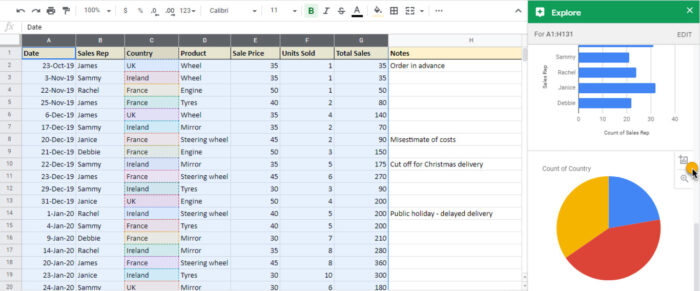
How to use Google Sheets’ pivot tables, column stats, Explore, & QUERY function
Beebole’s financial reporting gives you powerful, multidimensional insights into project time, costs, billing, budgets, and profitability, all without the need to build complex spreadsheets from scratch. But there may be times when you want to take that data even further, whether it’s for a custom analysis, an executive presentation, or a report tailored to a […]
Very good article on BI , can you please provide few case study on Airport operations and who all are leaders in implementing and consultancy services
Great BI helps businesses and organizations ask and answer questions of their data. Business intelligence can help companies make better decisions by showing present and historical data within their business context.
Exactly, Rich. It’s absolutely key in the decision making process today.