
Table of Contents
Table of Contents
For PMs Who Want to Actually Improve Project Profitability.
Customizable Reporting
Costs, Billing, and Budgets
20+ Integrations
Today we’re talking project cost management with adjustable forecasting and the Excel OFFSET function. Follow along below, or watch the tutorial on YouTube by clicking here.
The first time you heard about a forecast, it probably had nothing to do with project cost management. The team of weather experts behind that forecast used a range of data, inputs, and knowledge. This combination created an output you used to plan.
As we all know, weather forecasts are never perfect. But that doesn’t mean they aren’t useful. A directionally correct forecast is far more useful than intuition alone. The same applies to financial forecasting, which guides business teams on major decisions.
A financial forecast helps us to plan for an uncertain world. In project cost management, you have many variables to consider that could alter the project’s success. Calculating the range of outcomes is key to knowing when and how to adjust.
In this tutorial, we’ll work with Microsoft Excel and the OFFSET function to create flexible forecasts. These are absolutely key when it comes to project cost management. Using this approach, it’s easy to build a range of scenarios and predict outcomes. A quick reminder that you can watch this tutorial here.
Before we begin, you can download the Excel template showcasing the Excel OFFSET function here for the best results.
What is project cost management?
Project cost management definition:
Project cost management is a crucial part of project management that involves estimating, budgeting, and controlling project costs to complete a project within the approved budget while fulfilling its objectives. It starts with cost estimation, determining necessary resources and their costs. This is followed by cost budgeting, which establishes a cost baseline, aggregating all estimated costs. The final stage, cost control, involves tracking project status and managing alterations to the cost baseline, often employing tools like earned value management (EVM).

Effective cost management helps ensure a project delivers value and aligns with strategic goals. It involves understanding the project scope, risks, and schedules, and effective communication to manage stakeholder expectations. Efficient cost management prevents cost overruns, potential project failure, and potential financial loss, contributing to project success. It focuses not on cuts but on strategic resource usage for enhancing project value.
You can’t plan every failure (But you can plan to fail)
Forecasts are built on scenarios. Those scenarios consider a range of variables that may shift under varying conditions. These scenarios include internal and external factors and how they might change. While you can’t anticipate every scenario, you can build flexibility with multiple inputs. No one could’ve forecasted the global pandemic in 2020. But, forward-thinking planners had already performed “what-if analysis” work to stress test their business. You might not know the source of the impact, but you can test their effect on the business.
Scenario planning helps you build a range of outcomes when it comes to project cost management. And once you create those projections, you’ll think about how to act within them. As a project cost manager, uncertainty is all too familiar. You face countless questions about cost, project timing, and more. Running a sensitivity analysis across scenarios gives you visibility about how to respond.
Tired of the Headaches That Come with Forecasting?
See how Beebole can streamline the entire process.
What scenarios should you include when forecasting?
If you’ve got a sharp eye on your project cost management, you probably already know what factors influence your project’s success. Maybe your business relies heavily on a specific material that changes in price. Or, your market ebbs and flows with the economic cycle. The scenarios you build will vary based on your situation, so start by taking stock of your key drivers for success.
Here’s an example of three scenarios that you might generate when you build out a financial forecast:
- What if the revenue increased by 10% more than expected? While it’s great to exceed expectations, it also means you have an opportunity. A what-if analysis for revenue can launch a discussion of what projects to fund or initiatives to launch.
- What if your raw materials increase significantly? Are you able to reprice your products to include these costs, or will you be forced to accept a lower margin?
- What if inflation continues to increase? This scenario impacts practically all parts of a business. Whether it means higher healthcare costs, more expensive materials, or delays in shipping, scenario planning for higher inflation is a must.
If you’ve ever found yourself wondering, “What if this happened?” on a project, you should build out a scenario to test it. With the Excel OFFSET function, you’ll learn that you can build limitless scenarios and toggle between them easily.
When you’re running 100+ projects at once, a single inaccurate forecast can spiral into missed budgets and lost profitability. That’s why Rancho BioSciences uses Beebole for their project time tracking—and now they track every hour, cost, and budget in real time.
With Beebole, they can:
🚀 Catch cost overruns before they become a problem
🚀 Build forecasts grounded in real project data
🚀 Eliminate invoice disputes with accurate time and budget tracking
🚀 Give leadership the clarity they need to act fast
How to create an adjustable forecast with OFFSET (Watch and learn)
Now that you’re ready to build your forecast, it’s time to jump into Excel. We’ll build a spreadsheet that includes a range of scenarios, and then give you the tools you need to calculate the outcomes.
In the screencast below, you’ll learn how to build and test your forecasts with OFFSET. You can create inputs and then apply calculations to generate a forecast.
Watch the tutorial
 There's more where that came from.Don’t miss a single video.Subscribe
*Discover more tutorials and webinars in Beebole’s video collection.*
If you want to see how to build the spreadsheet in a series of steps, read on. I’ll walk you through using Excel to create scenario planning templates.
Start by downloading the OFFSET forecast spreadsheet
Let’s walk through creating a flexible project cost management forecast. We’ll build out a range of scenarios and then add OFFSET functionality that allows us to switch between them easily.
To follow along with this tutorial, download the finished OFFSET Forecast spreadsheet. You can use it as a guide to add your scenarios and estimate project costs.
Create your scenarios
With project cost management in mind, here are recommended variables for my scenarios:
- Project start date: The date that the project investment is made.
- Build time: How many months will it take to complete the project?
- Total project investment: How much will you invest in the project?
- Customers added per month: Once our project is complete, how many customers will start using the product?
- Monthly customer revenue: While customers will vary, it’s important to build in an average revenue per customer.
- # of customers churning out: Customers may leave over time, and it’s important to factor this.
- Cost of sales %: Once the product launches, there will be costs associated with it. Let’s use a percent rate to apply to the revenue.
In Excel, it’s best to create a standalone tab that includes each of these scenarios. The table below includes each of the seven factors I’ll use in my forecast.
Important: To make full use of the offset function, make sure to create a row labeled Scenario #. Each scenario has a number so that we can shift between them with ease.

Think of your forecast as a sensitivity analysis: “If a given factor changes by X%, what’s the impact on my earnings?” With these scenarios, we can test exactly that.
Add your scenario details
Now, it’s time to build a projections tab that connects to our scenario variables. With this set of projections, we’ll see a detailed calculation for our project financials.
Let’s switch to a new tab and lay out our spreadsheet. In my case, I’m going to create a column for each month between 2023 and 2025. Then, each row in the forecast model uses an input variable.

Go ahead and add placeholder rows for each of the row calculations we need. Don’t worry about perfecting these formulas for now; just ensure that there’s a row placeholder for each.
How to include a control panel
Also, I’m going to use the highlighted section in the cells above as my control panel. This is the area where we can change the scenario number and recalculate everything we need:
- In cell B2, we’ll type a number that corresponds to our scenario of choice. By default, I’ll put in 1. Remember that we numbered our scenarios in the prior step. You’ll change this cell anytime you want to see a new scenario.
- In cell B3, I’m going to use an HLOOKUP formula. You can reference this in the downloadable spreadsheet, but this will automatically update with the scenario name as the scenario number changes.

There’s another important component to this spreadsheet, and that includes the scenario details. Remember, we built these out on the standalone Inputs tab. But we’ll carry them through to this tab so that we see the scenario details.
Here’s the goal: as we change the scenario number, we pull all of the details of that scenario through to our Projection tab. So, how do we make the calculations dynamic as the scenario number changes? This is the power of the OFFSET formula.
Just below the area we built for projections, let’s add our Scenario details. Don’t retype these details—let’s connect them back to our Scenarios tab. We want to build this dynamically so that as the scenario number changes, so will all of the inputs.

Time to use the OFFSET function
Let’s write our first formula for the Project Starts date, which will use the OFFSET function:
=OFFSET(Inputs!C7,0,Projection!$B$2)This formula follows a few steps, with each step separated by a comma:
- It looks at the Inputs tab in Cell C7. Remember that this is the first sheet in our workbook where we created scenarios.
- It shifts the reference by 0 rows because we don’t want to move down rows versus our reference cell.
- It moves our reference over by the number of columns in Cell B2 on the same tab. That’s our control panel, where we tell Excel how many columns to move over.
Now, every other cell is a matter of simply moving the reference cell from Inputs down by one column. Notice the similarity in the formulas, as they all point to a scenario, shifting only based on the scenario you select.
| Variable | Formula |
| Project starts | =OFFSET(Inputs!C7,0,Projection!$B$2) |
| Build time | =OFFSET(Inputs!C8,0,Projection!$B$2) |
| Total project investment | =OFFSET(Inputs!C9,0,Projection!$B$2) |
| Customers added per month | =OFFSET(Inputs!C10,0,Projection!$B$2) |
| Monthly customer revenue | =OFFSET(Inputs!C11,0,Projection!$B$2) |
| Customers churning out | =OFFSET(Inputs!C12,0,Projection!$B$2) |
| Cost of sales % | =OFFSET(Inputs!C13,0,Projection!$B$2) |
| Customers start | =EDATE(D18,D19) |
The last formula for “Customers start” uses the EDATE function to shift by a specified number of months. It takes the start date and adds the scenario’s “Build time” variable to know when revenue should start.
So far, we’ve got everything “hooked up” in this model. We’ve brought through the scenario details from the Inputs tab. Read on to apply the needed calculations for optimized project cost management right in Excel.
Add your forecast calculations
We’ve pulled through our scenario details. Now, it’s time to create our projections. Projections take details from a scenario and then apply calculations to them.
As part of our forecast, we’re going to make all of the calculations that you see below. While every forecast differs, it should include each of your input variables in a calculation.

Let’s walk through the formulas built for each of these rows, plus a short explainer of how it works. The example formulas use column E, but work as you drag them across to each month.
The forecast calculations
| Cell | Formula | Explanation |
| Investment made | =IF($D$18=E2,$D20,0) | This formula looks at the scenario table and compares the date to the “Project Starts” date. It then inserts the project investment amount. In essence, the formula fills in the investment in the intended start month. |
| Customers added | =IF(E2>=$D$27,$D$21,0) | This formula looks at the scenario table and inserts the number of customers added. But, it only does this if the date is after the project completion date. (After all, we shouldn’t have customers before our project finishes.) |
| Customers churned out | =-IF(E2>=$D$27,$D$23,0) | Similar to the “customers added” input, this includes the number of customers we lose each month. Again, it uses the “Customers start” helper field. |
| Net # of customers | =(E6+E7)+D8 | This formula multiplies customers times the average revenue per customer. |
| Revenue | =E8*$D$22 | This formula multiples customers times the average revenue per customer. |
| Cost of sales | =-$D$24*E10 | This formula multiples the revenue times the cost of sales. Since this is a cost, we multiply it as a negative. |
| Gross profit | =E10+E11 | Gross profit is revenue less costs in this formula. |
| Cash impact | =E13-E5 | This formula is designed to estimate the total cash impact, which includes the investment cost. |
With these formulas, we have a complete projection of how our project performs. Simply change the scenario number in the control panel cell, and every formula is calculated. Because we used the OFFSET function, all formulas will shift accordingly.
Add a forecast summary
Our forecast is complete! We can test out scenarios and study the results.
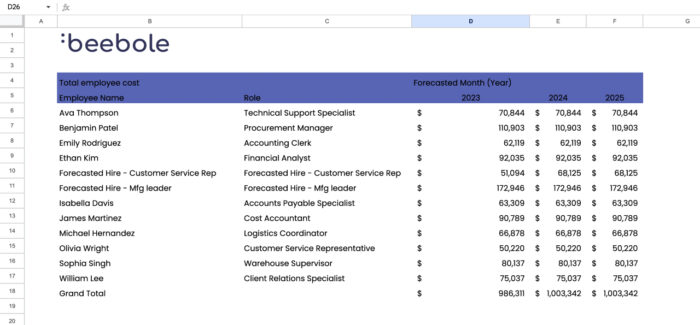
An important part of creating a forecast is sharing it. A summary of the months into year groupings is a great way to do that. On a new Summary tab, I created sums of the months for each financial metric.
This table gives me a ready-to-share visual. Make sure also to link the scenario name from the Projection tab so that you remember which projection the summary shows.

This simply sums up the months of each year. Save the work of recreating this yourself with our included template.
Conclusion: Now you can build a forecast & take your project cost management to the next level
Now, it’s your turn. It’s time to take a step back and ponder what scenarios your business should test. Then, build out a range of possibilities that test the future. This is a beautiful piece of the puzzle that is project cost management.
Remember: Your forecast doesn’t have to be perfect. It’s only a guidepost that you use to steer your decisions. The flexibility you can build with the OFFSET function shows that predicting the future doesn’t have to be painful or time-consuming.

—
Photos by Brian McGowan and Ross Sneddon on Unsplash
The experts who have written or contributed to this article are independent from Beebole, and their contribution doesn't serve as endorsement for our company/tool or their past/present organizations, employers, or associates.

Andrew Childress is a former FPA & CFO with a passion for simplifying, understanding, and analyzing financial data. He founded the FP&A consulting firm Beyond a Number to show others that great financial planning really starts once you go beyond the spreadsheets and numbers, and truly understand the data in front of you.
Related posts
Top 10 best time tracking tools with automated timesheet approval workflows for managers
Timesheet approvals are the backbone of billing and payroll—and a dependable source of insight into pricing, productivity, and profitability. Done right, people are paid correctly and on time, errors and unauthorized overtime drop, and labor-law compliance gets easier. Manual chains are slow and brittle. Automated workflows route timesheets to the right manager, enforce edit windows […]
20 project time tracking tools for enhanced project financial management
There is a considerable number of project time tracking tools on the market. Because there are so many options, we’ve created this guide to today’s top project time tracking tools, making sure to include tools that offer features and price points to meet the needs of teams and businesses of all sizes. Project time tracking […]
The true cost of employees: Calculate employee cost with this labor cost spreadsheet
Understanding the true cost of employees is crucial for any business looking to manage resources effectively. That’s why we’ve created this free spreadsheet download and video tutorial with detailed instructions and formulas to easily calculate employee cost at your company, as well as to forecast new hires. It’s more than just base salaries; it encapsulates […]