How to use Power BI for planning, budgeting, and forecasting

Table of Contents
Table of Contents
Is your organization stuck in spreadsheet chaos because your teams use unnecessarily complicated planning, budgeting, and forecasting tools? For example, when it comes to business budgeting, planning, and forecasting, many top-tier companies still rely on “the good old” Excel or some similar specialized planning tools like SAP BPC, Hyperion, or Workday Adaptive.
Nevertheless, do you know that you can do and achieve all of this within the Microsoft and Power BI ecosystem? Indeed, Microsoft Power BI and its immense ecosystem of add-ons are now the leading software package for planning, budgeting, and forecasting, mainly if your organization is or strives to become a Power BI powerhouse. It’s also worth noting that Microsoft has also launched Copilot, staking its claim in the world of AI.
Whether you’ve purchased Power BI or are considering it, you’ll want to ensure you get the most out of this investment.
Getting the most out of Power BI
Professionals sometimes get tunnel vision with Power BI. They might think it’s reserved for particular use cases and business units, or that it’s simply a reporting tool. Sure, Microsoft’s Power BI is an extraordinary data visualization tool. However, you can use it to create, manage, and collaborate on your organization’s planning, budgeting, and forecasting processes. It can also be used for everything you do in Excel or your specialized planning tool that you’re certainly overpaying.
So, that’s the goal for today: We’ll learn how to get more out of Power BI. Specifically, we’ll see how you can use it for almost any planning use case and analysis with the right know-how.
In this article, we’ll review how to use Power BI for business planning, budgeting, and forecasting in your day-to-day work. We’ll also see how to take your data-driven decisions to the next level. Let’s first see the latest data analytics trends of Power BI in organizations and the benefits of Power BI adoption.
Data analytics trends of Power BI in organizations
Power BI is a business intelligence and data visualization tool that uses visual analytics to help companies make the most out of their data. The engaging visualizations created in this software take that old-school Excel workflow to the next level. Obviously, this can help companies make the most out of their massive amounts of data.
As Power BI continues to dominate the market, let’s take a look at the top trends to aid in better budgeting and forecasting.
Artificial intelligence and trend analysis in Power BI
Artificial intelligence may be utilized to automate data analysis for planning, budgeting, and forecasting. It may also be used to cut down on human workers that may be inefficient and inaccurate in their efforts. You can use Power BI’s artificial intelligence technology to capture real insights that a human may not pick up.
From there, the predictive analysis in Microsoft’s Power BI could translate into colossal returns. Professionals foresee more significant use of the predictive capabilities of the software for the three essential operations.
More collaborative business intelligence
Collaboration is at the center of any successful business operation. Budgeting, planning, and forecasting operations are no exception to this. Bringing together people with different skill sets can ensure that your operations will achieve their potential. That’s why being able to share the product and edit can significantly improve the outcomes of each company report.
In that context, granted access to the best and most up-to-date data can drive better collaboration and lead to more informed business decisions. The trend of data democratization within Power BI is expected to continue, with the software identifying bottlenecks and points of weakness and permitting C-level managers and those on the floor to collaborate on solving problems and thus providing more collaborative BI for planning, budgeting, and forecasting.
Use-cases of Power BI for planning, budgeting, and forecasting
Using write-back in Microsoft’s Power BI
First things first, the write-back capabilities of Microsoft’s Power BI provide the end-user with a wide range of options. Enter, update, or edit text, numbers, and data models, and behold the immediate impact of these changes. The write-back option lets you add notes or modify drivers for a specific data metric directly on the visual. This provides your organization with all of the capabilities and flexibilities of your legacy tools and processes, along with Power BI’s rich experience.
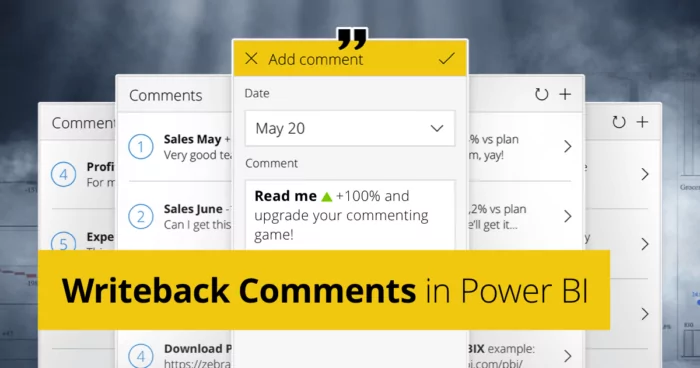
For instance, when analyzing a profit and loss report, employees can make rapid, scenario-based changes to the data by typing directly into the visual. Afterward, the visual will then write it back to your on-premise or cloud Power BI server. This means that the latest data reflects in your planning, budgeting, or forecasting report immediately. On the whole, with write-backs in Microsoft’s Power BI, your teams can:
- Promptly interact and hypothesize on different variables and drivers (i.e., pricing, sales, expenses).
- Instantly budget and forecast at any level of granularity by scenario. Plus, immediately acknowledge the results reflected across the entire organization or in a dedicated department.
- Help them communicate and collaborate more easily on the financial or operational impact of critical business decisions with executives in real-time.
Creating an efficient reporting workflows with Power Automate
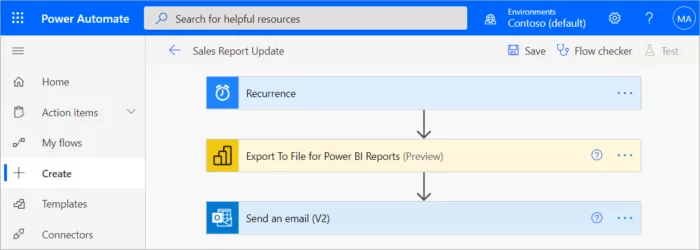
Once you get a feel for Power BI’s planning and analytics capabilities, there are many other applications in the Power BI umbrella worth exploring. For example, by using Power Automate, you can certainly automate exporting and distributing Power BI reports for all three scenarios. Here’s a quick example of how you can create your own flow from scratch and distribute your reports via email.
To create an efficient reporting workflow, you need to have the following prerequisites:
- At least one workspace in your Power BI tenant backed by a reserved capacity
- Access to the standard connectors in Power Automate, which come with any basic Office 365 subscription model
From there, you can create your flow from scratch. This will eventually round up with drafting a Power BI report as a PDF and automatically attaching it to an email to be sent on a regular basis.
Setting up the scheduled flow
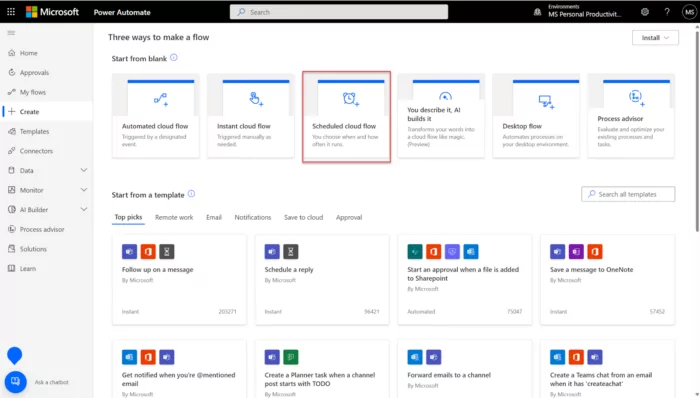
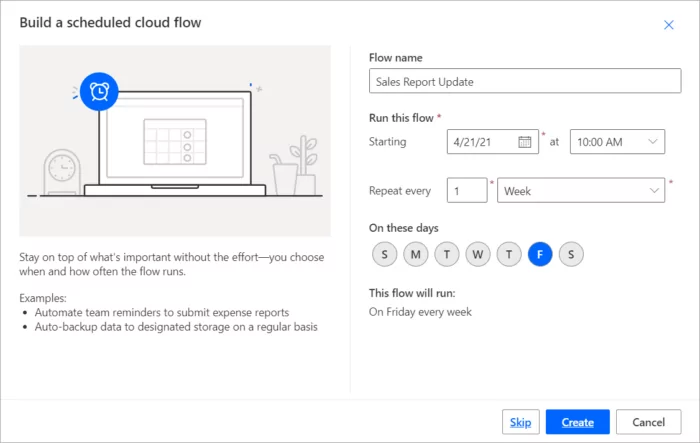
Sign in to Power Automate, and select Create > Scheduled cloud flow. From there, in the build a schedule flow section, give your flow a unique name. Afterward, select the Run this flow button and choose the starting date and time for your reporting flow and the repetition frequency. When you get to the On this days section, select the days on which you want yourreport flow to run. Select Create.
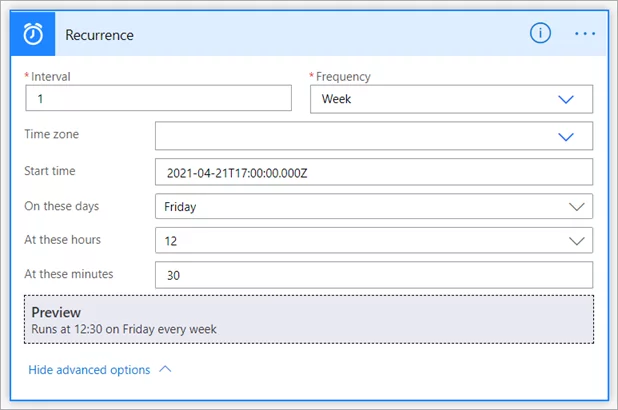
When you get to recurrence, select Edit and then show advanced options. Enter a value in at these hours and at these minutes to set a particular time for your reports to run.
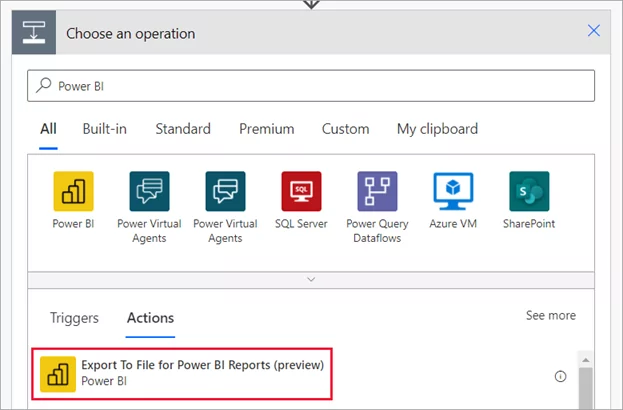
From there, select New step. Then in Choose an operation, search for Power BI and select export the file for Power BI reports.
In the Export to file for Power BI reports section, choose a workspace and report from the dropdowns. Afterward, select the desired budgeting, planning, or forecasting report export format for your final Power BI report.
Sending Reports with Power Automate
Once you’ve selected your BI report’s format, select New step, then Choose an operation. Search for Outlook, and select the Send an email option. Complete the To, Subject, and Body fields for the emails, and enter a name for your attachment. For this example, let’s say something like: “Q1 Budgeting report for XYZ.” In the Attachment section, don’t forget to select the file you previously created and attach it to your exported Power BI report.
When you’re all finished, select either Save or Next step. The Power Automate software will then create and evaluate your reporting flow and will let you know if it finds any errors. If there aren’t any errors to address, view the flow details for one last time, and after ensuring that everything is OK, you can now run the flow. When you do it, Power Automate will export a Power BI report in your desired format and send it as an automated email attachment when scheduled.
As you can tell by now, Power Automate enables organizations of all sizes to put intelligent workflows and automated business processes into action in their Power BI-based reporting system. System interactions, such as approvals and workflows, are mapped out in both quantitative and qualitative terms in a strictly automated fashion.
Put differently, thanks to the incredibly high integration capabilities of the Power BI platform, you can absolutely democratize your data and unify your reporting and analysis processes into a more complete and automated package than you can do with any other available software.
Other key features of Power BI for planning, budgeting & forecasting
As you can sense now, Power BI is perhaps the most robust data analytics and visualization tool on the market nowadays. A tool that can draw data directly from various sources, including all kinds of planning, budgeting, and forecasting data that can reside in nearly all ERP systems and Excel. In such environments, Power BI can function as:
- An aggregation and modeling tool to aggregate separate planning, budgeting, or forecasting datasets;
- The most effective method to conduct a complex planning process where one needs to implement a single central data model solution that permits the end user to read and write back;
- A data model totally customized to how the organization operates permits the integration of corporate performance management tools that can be used in conjunction with Power BI’s reporting capabilities.
Final words on better planning, budgeting, and forecasting with Power BI
In the end, as you can see, Microsoft’s Power BI is by far the fastest-growing and most popular business intelligence tool, and for a good reason. It genuinely brings endless capabilities for companies of all sizes like no other software in today’s market does. Leveraging Power BI’s write-back, power automation, and other tools for planning, budgeting, and forecasting can help you bring your company to the next level and enhance the ways in which your organization works when it comes to these processes.
Sure, becoming a power user and learning how to leverage Power BI for the most essential business operations is not the most straightforward resolution you can set for yourself in 2023, and it constitutes a significant learning curve.
However, if you’re willing to take your organization to the next level and reinforce the ways in which your company operates, consider:
- Encouraging your teams to go through Microsoft’s guided learning resources
- Taking part in Microsoft’s hosted webinars,
- Visiting and start learning from the official Power BI online community
- Viewing learning videos on YouTube
- Enrolling in a dedicated Power BI course to start preparing themselves for the future of business planning, budgeting, and forecasting
—
Photo by Razvan Chisu on Unsplash
Comments
Related posts
Headcount planning explained: How to tackle budgeting & forecasting headcount (The right way)
Published: 2024/2/7 | Paul BarnhurstSenior leadership at every company needs to have confidence in the hiring plan. The hiring plan is vital to achieving ...
Mastering data: The guide on business intelligence tools (and everything else you need to know)
Updated: 2023/12/8 | Carlos QuintanaThere are three words that have transformed business intelligence (BI) into one of today’s most popular topics: data, data and ...
3 examples of Microsoft Copilot for financial planning & analysis
Published: 2023/12/12 | Andrew ChildressAs artificial intelligence grows in popularity, every company is now competing to launch tools that leverage AI inside their existing ...


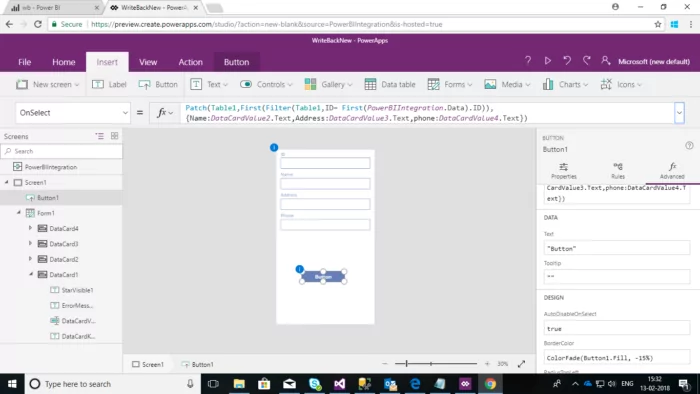
Budgeting is a common activity in the business world. But, since PowerBI is a “pull” system versus a “push” system, it is a little bit complex.
We budget at the General Ledger / cost centre level. We use POwerBI to bring in the actuals by month for the past 12-18 months. We then need 24 – 48 additional columns to add in the plan data for those periods. The vision was to present to the various department heads, their data by selecting their department codes. They would then key in their department information. Great! Now hit save on the page and the information is saved to the underlying database Table(s). Not so great unfortunately because this update is not possible. PowerrAPPS, an addOn widget to assist? Any suggestions is much appreciated.
Thanks
yes, to convert Power BI from a Pull system to a Push system (that is having Power bi take inputs), I’d recommend using Power apps to be created, and embedded into power BI. It is 100% doable, and I find it very reliable as it all belongs to the Microsoft Power “family”