Table of Contents
Table of Contents
The Beebole Microsoft Excel add-in has arrived! With this new tool, you can connect spreadsheets directly to your Beebole account. That makes it easier than ever to analyze and work with your time tracking data.
Let’s learn how to set up the Beebole add-In in this tutorial, as well as how to use it. At the end of this tutorial, Excel will talk directly to Beebole so that you’ll never need to download data manually again.
If you prefer to watch these tutorials, you can learn how to install the add-in here and how to use the add-in here.
What you need to get started
To walk through this tutorial, make sure that you have both of the following:
- An active Beebole account, ready with time tracking data to test out
- Microsoft Office365
How to install the Beebole add-in
After you’ve set up Excel and Beebole, it’s time to install the add-in. Let’s walk through how to do just that.
We’ll connect to Beebole with the official add-in. If you’ve never used an add-in, think of it as a tool that adds power to Excel. In this case, the Beebole add-in removes the manual work of downloading your time tracking data for analysis. Press one button, and the add-in imports time tracking data automatically.
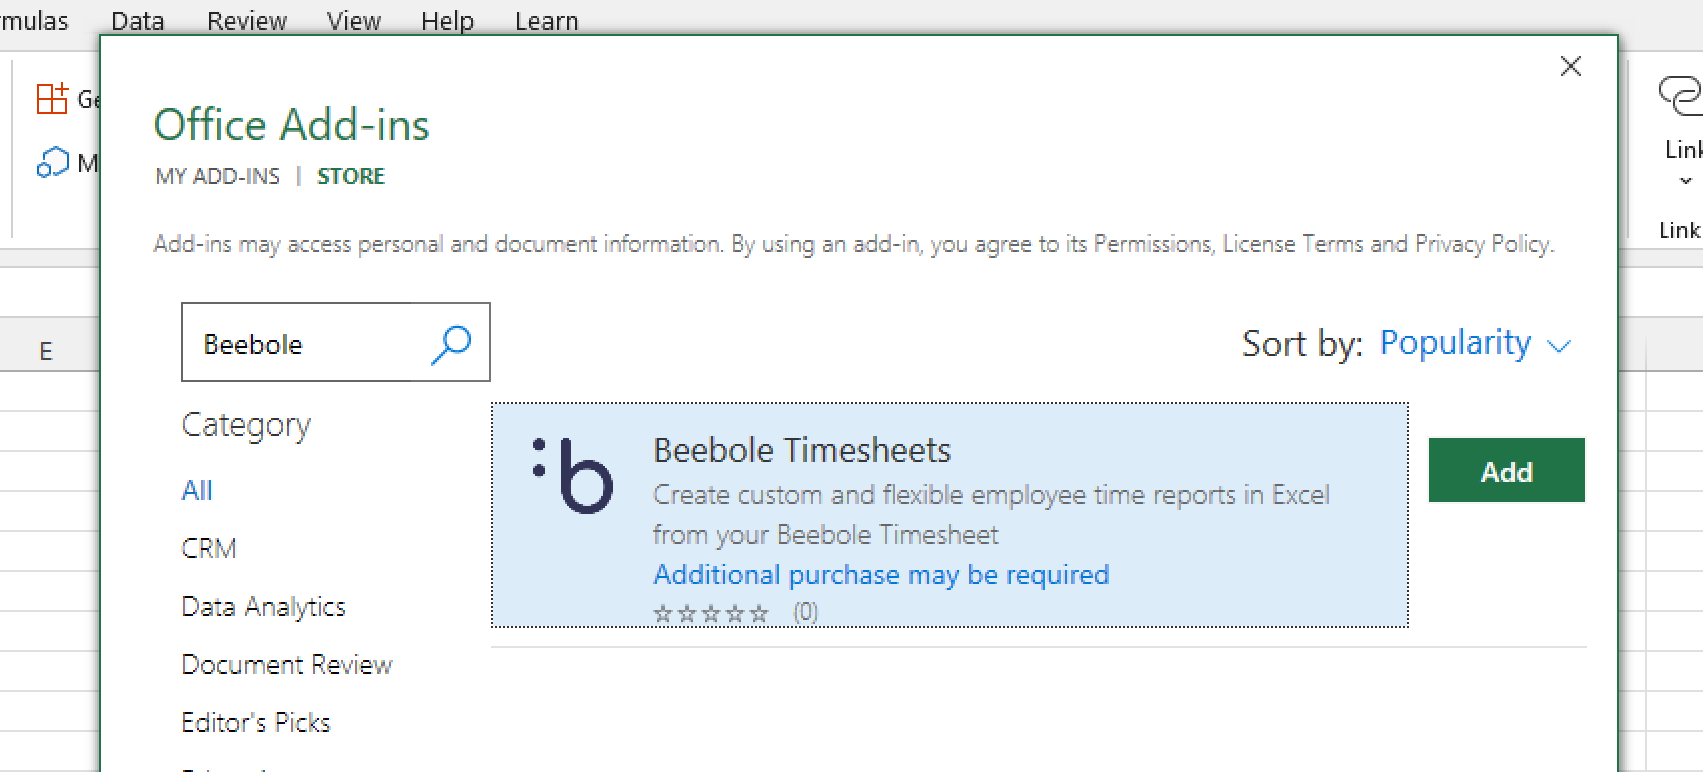
In Excel, select the Insert tab on the ribbon. Then, click on the Add-ins dropdown and choose Get Add-Ins.

Now, you’ll see a new window that acts as a browser for Excel add-ins. Find the official Beebole add-in by searching “Beebole” in the box you see in the upper left corner.
After you press enter, you’ll see the official Beebole add-in showing. Click on Add, and Excel will install the add-in for you.

You’re ready to connect the Beebole add-in to your account. Find the Beebole Timesheets icon on the Home Tab. The first time you install the add-in, you’ll see a welcome message. Click on the add-in icon to configure it to work with your account.

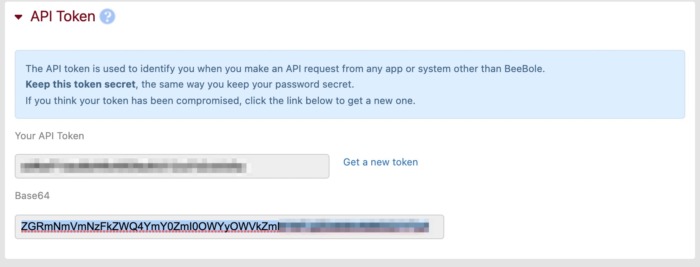
Now, we need to get an API token from our Beebole dashboard. This magic key helps authenticate the add-in to talk to the time tracking data that lives in our Beebole account. You’ll see the field API Token (Base64) in the pop-up window.

Let’s switch gears and open Beebole in our web browser. Go ahead and log into your account and reach the Beebole dashboard so that we can retrieve the API key.
The easiest way to find your account’s API key is to click on the Customize option at the top of the dashboard. Type “api” into the search box that opens up, as you can see in the screenshot below.

Now, drag and drop the label API Token onto your dashboard. This will make it easy to view the API key that we need.
You’ll see the new panel labeled API Token, similar to the screenshot below. Make sure you grab the value from the Base64 window and copy it to your clipboard.

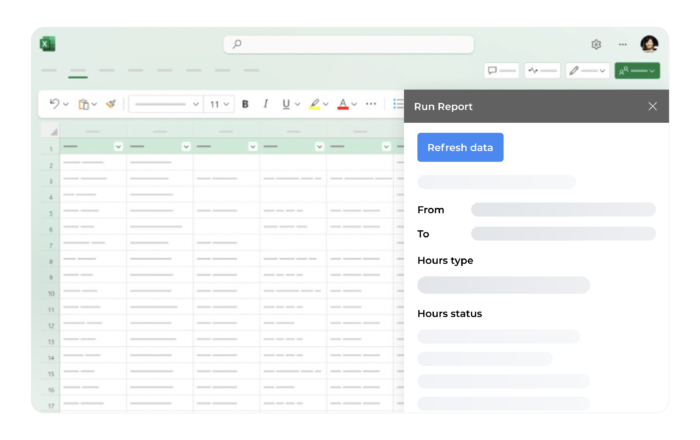
Now, return to Excel. Paste the API key and confirm the settings. You’ve now connected Excel to your Beebole account. To test out the connection, click on Refresh Data in the sidebar. You should see data pulled into the spreadsheet.

If your connection doesn’t work, try out these simple troubleshooting steps:
- Make sure that you’ve used the Base64 API key. There are two keys in your account, and the Excel add-in needs this specific one.
- Ensure you have data in your Beebole account; if you press Refresh data and don’t see any data, it might be because there’s no data to pull. Check that the “From” and “To” dates in the panel match the entries to test.
- Ensure you’re not experiencing any internet connectivity issues. The add-in only works if it can talk to the Beebole servers.
That’s it! With these simple steps, your Excel workbook is now connected to your Beebole account. Anytime you press Refresh, this add-in will bring in up-to-date data.
Taptu shows what’s possible when you connect Beebole to your Microsoft tools. This Australian IT consultancy built a custom integration with Beebole, Xero, and Office 365 to automate timesheets, invoicing, and payroll. The result?
🚀No more manual data syncing
🚀Fewer errors across systems
🚀A nearly fully automated operations pipeline
If your team is using Excel with the Beebole add-in, Taptu’s story proves just how far you can take your data with the right integrations.
Watch the tutorial to install the add-in
You can find more tutorials, webinars, and other resources on Beebole’s video collection page.
How to use the Beebole Timesheet add-in for Excel
Now that you’ve successfully installed the add-in, let’s learn how to use it. Beebole and Microsoft Excel are a match made in heaven.
In Beebole, you have a powerful tool that helps your team track and monitor time. Excel is a powerhouse for analysis that helps you find meaning in your data. With the add-in you can automatically pull data into your spreadsheet and work with it. It’s always up-to-date, and in this tutorial I’ll give you ideas to make the most of it.

Open the Beebole Timesheet add-in for Excel
After you install the Beebole add-in, it’s time to pull some test data. The first step is to validate that your connection to your Beebole account works with a quick sample data pull.
Click on Beebole Timesheets on the ribbon to open the add-in panel. This will open on the right side of Excel. Start by selecting a time period that you know you have time tracking data logged for. Then, press Refresh.

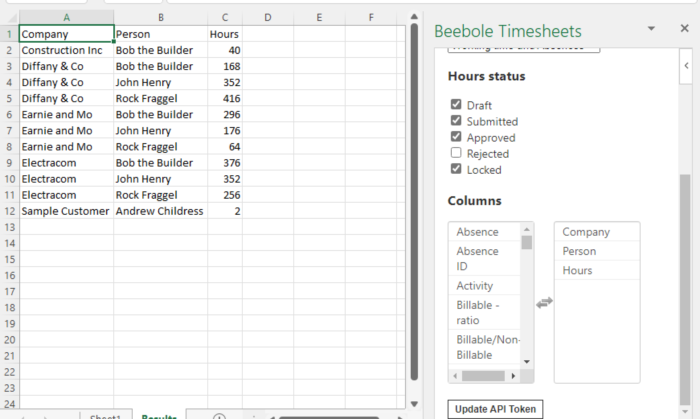
The Beebole add-in will put data that meets your criteria in a sheet titled Results. This is a direct pull from your live, active Beebole account.
How to set the basics Beebole data pull in Excel
The Beebole add-in gives you many options for how to query your time tracking data. Let’s learn to set a couple of basic options that apply no matter what type of data you pull:
- Set the date range – the first option you should set is the date range for your time entries. Click on the From field and choose a starting date, then a To date.
- Pro tip: I recommend always pulling data for all available dates. However, if you have a very large data set, you might want to restrict this. In a later step, we’ll filter the data to include in a summary built with an Excel PivotTable. It’s best to pull everything at once and then refine your selection with analysis tools.
- Hours type – Beebole tracks data for working time and absences. With this dropdown, you can refine which of the time entries you wish to pull.
- Hours status – The Excel add-in gives you a powerful option to review not only approved time entries, but also hours in draft, submitted, rejected, and locked status. Think of using this option to review vacation hour requests, for example.

Check these three options before you pull any data. Think first about what you’re curious about, then refine these settings. To test your adjusted settings, press Refresh to update your data. Make sure you’ve selected at least one column any time you pull data.
How to customize your Beebole data pull
Now, it’s time to get creative with our data. My default view in Excel included the company, person, and hours worked by each employee. But these are just a few of the fields that I track and am interested in.
Luckily, the add-in makes it a breeze to modify the fields that we pull from Beebole. The basics are this: if you capture it in Beebole, you can pull it into your Excel spreadsheet. The add-in gives you an incredible amount of power to connect to your time tracking data.
Let’s turn our attention to the Columns to select. Think of these as the fields in our Beebole data set. On the left side of this panel are the fields you can pull in (inactive), and the right side shows the active fields in your report. The list of columns is sorted alphabetically, but any custom fields and groups you create in Beebole will be at the bottom of the list.

Let’s test this out. I’m going to add several fields to my view. Let’s add in Date and Project by clicking on them in the left list.
Now, they’ll move to the right side. If you don’t see the data added to your spreadsheet yet, that’s to be expected. Scroll back up on the add-in and choose Refresh data to update your pull.

That’s it! You’ll see those fields added, and your spreadsheet will be updated with the new data. If the columns are blank, it’s because your original time tracking data doesn’t include this information.
There are countless fields that you can choose from. How you use them is up to you! Think about the questions you want to answer, then add the fields to your report.
How to pivot your Beebole add-in data in Excel
So far, we’ve focused on pulling in data from our Beebole account into an Excel spreadsheet. This is a powerful connection that links to our time tracking data with no manual downloads required.
But this is only the beginning. In reality, data becomes powerful when we leverage it as part of an analysis.
The way that I typically structure my workbooks is to use a standalone sheet to pull data and other sheets to analyze that data. The Beebole add-in helps by pulling your time tracking data automatically. Then, I use an Excel PivotTable to analyze the data flexibly.

To add a PivotTable, start by highlighting all columns that include your data. It’s important that you highlight the entire column and not just the rows because you’ll likely add more rows of data with each refresh. Then, choose Insert > Tables > PivotTable.
Now, you have a powerful tool to build a report with. Drag the fields you’re interested in into the appropriate field. For example, putting Date in the Rows box adds date data to each row. Drag Hours into the Values field to sum up the number of hours worked.
See the example below for a quick report I built in mere seconds.

Of course, this pivot gives you the freedom to easily create other views with a couple of clicks. In the example below, I dragged Project into the rows to view each project in its own row.

When you’re ready to update your report, re-open the Beebole add-in from the ribbon and press refresh data. Then, right-click your pivot and choose refresh. With just a few clicks, your reports are magically updated.
Start working with Beebole data today
In this tutorial, you saw the power of using the Beebole Excel add-in to pull time tracking data. The combination of Beebole and Excel can help you create reports that are always up to date.
Tap Into Your Time Tracking Data
Start thinking about how you can use this connection to create important time tracking analyses. If you use Beebole and Excel, don’t forget this tool to work with your time data in the most efficient way possible.
Watch the tutorial to use the add-in
Want to learn more?
If you found this article helpful, you won’t want to miss some of the other tutorials we’ve written using Excel. Check out this post on building an automated time tracking report, this tutorial on how to automate sending emails right from Excel, or this guide to troubleshooting your Excel workbooks.


