Excel formulas not working: 5 critical examples of checking & fixing workbooks

When it comes to working with data in Microsoft Excel, especially if it wasn’t your data to begin with, things can get tricky quickly. Between Excel formulas not working, human error, and simply trying to understand someone else’s thought process, there are a lot of ways checking and fixing an Excel workbook can go wrong. That’s where this post comes in. Written by Excel MVP, creator at the YouTube channel Excel on Fire, trainer, LinkedIn instructor and co-host of ExcelTV, Oz du Soleil, this article will dive into five critical examples of checking and fixing an Excel workbook, a situation managers—however reluctantly—might find themselves in.
–
This article is just one of the tutorials on our blog. We often ask spreadsheet experts to share their top tips for managers, creating actionable tutorials that professionals can start putting into practice today.
–
During the very first Excel course I taught, back in 2010, I met TJ. She was a warehouse manager who, though very skilled in many ways, wasn’t savvy with Microsoft Excel or data. For her particular role, she relied on other people’s spreadsheets, with data on scheduling, inventory, performance, products, and more. Since Excel wasn’t her strong suit, you can imagine why this was concerning. And she’s not alone.
More people like TJ have been blindsided by spreadsheets and data as the entire world becomes more data-driven. Nothing is more frustrating than Excel formulas not working. They start at a job—maybe driving a forklift or designing logos—and they move up to leading small teams. Their skills might be more geared towards resolving conflict, motivating teams, sales, or operating heavy machinery. But then there’s the promotion to a role that’s less about people and hands-on work, and more about data. ?
As I wrote this article I’ve kept several people in mind:
This article won’t take you into the guts of Excel—more than a how-to, it’s a what to look for. This article strives to get you thinking about the quality of your data and spreadsheets, as well as the skill of the people whose Excel files you rely on. If there’s an Excel formula not working, one of these tips might lead you in the right direction.
I’m going to share several features of Excel that can help you do quick, high-level investigations of someone else’s work. Can you trust the data? Can you trust the person who made the spreadsheet? Does that person practice good spreadsheet habits?
Those last two points are critical. Over the years as a consultant, I’ve had to break the news to several managers that the person in charge of their spreadsheets might be accurate, but their bad habits are a ticking time bomb. Now it’s time to find out: Is that the case for you, too? And yes, these might very well be tips to improve your own spreadsheets, too.
Let’s dive in!
The image below shows what these four people need to be paid. There are no formulas. Someone typed these numbers directly into the cells. And there’s a problem in cell E5.

According to cell E5, we owe $59.25 to H241. After doing the math:
30 hours * $19.75 = $592.50
OUCH! ? Someone used a calculator to do the math, then made a very human mistake of a typographical error and put the decimal in the wrong place. Of course the Excel formula is not working because there was no formula to begin with!
Formulas should be making these calculations, especially when we’re talking about critical data like money. Sure, this is a simple example. But hard-coded values are often applied when calculations get more complex.
Another problem arises with hard-coded values when the data needs to be updated. Let’s say, H327 actually worked 29 hours and their rate has gone up to $45/hour. Formulas will automatically update the Pay in Column E. By using a formula instead, we don’t have to rely on someone to remember to manually make the update and accurately do so.
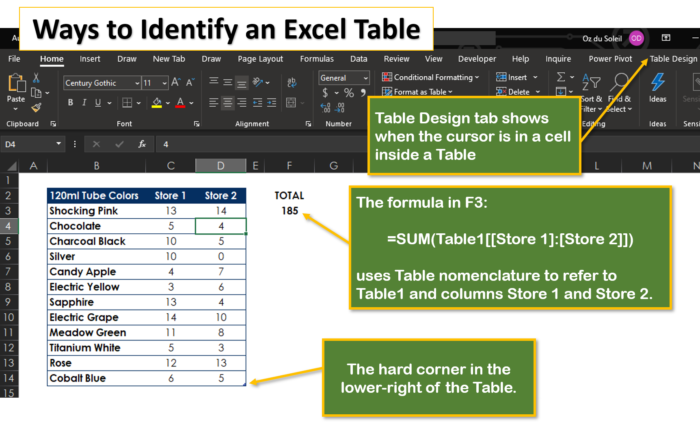
The number one Excel feature that people should use more is Tables. Tables are the glue that holds your data together. If you receive a workbook that doesn’t have tables in it, be wary. Tables help ensure that data is integrated and that formulas cover complete columns. If your Excel formula doesn’t seem to be working, this might be why.
In the image below, the data in columns C and D are totaled in F3: 185. The total for columns K and L is in H3: 122. They should be the same. What’s going on?
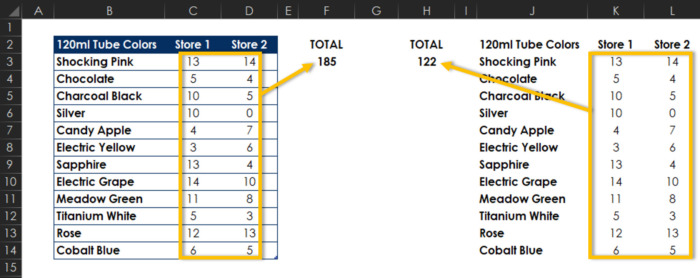
In F3 the formula is:
=SUM(Table1[[Store 1]:[Store 2]])
Because the dataset is in a formal Table, the SUM formula includes the entire columns Store 1 and Store 2 in the table named Table1.
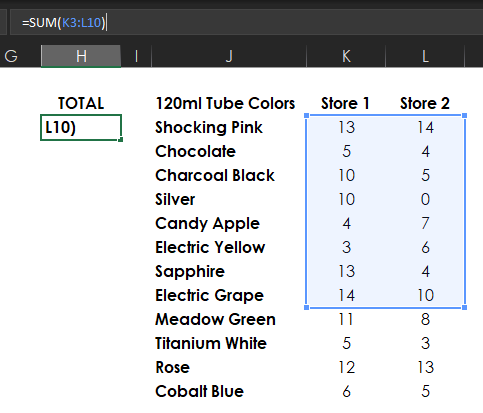
In H3 the formula is: =SUM(K3:L10)
By selecting H3 and placing the cursor in the formula bar, we’re able to see what area is covered by the formula. It stops counting at Electric Grape.
How does this happen, you might wonder?
Well, sometimes a person adds data slowly, whenever it happens to come in. Done this way, it’s easy to forget to modify the formula. However, when adding new data to a table, the table absorbs the new data, applies existing formulas and updates calculations … automatically. Insist that tables be used by the people who are sending you Excel files. And when in doubt about an Excel formula not working, check and see if a table is being used or not.
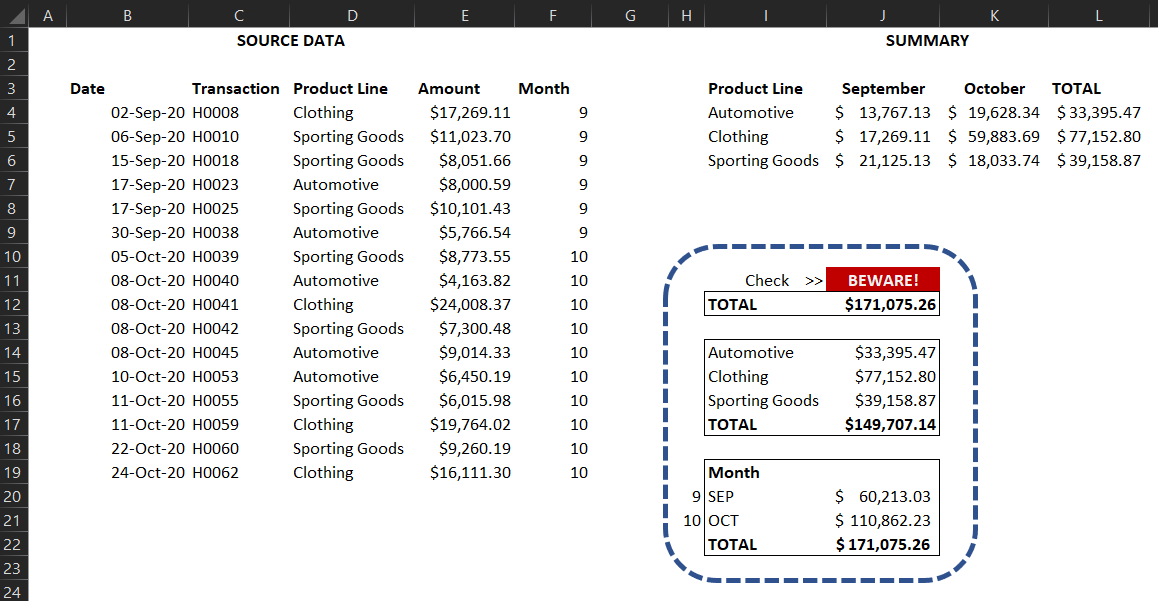
It just arrived! The Excel workbook with the summary that we’ve been waiting for. It includes the breakdown of data by month, and by product line.
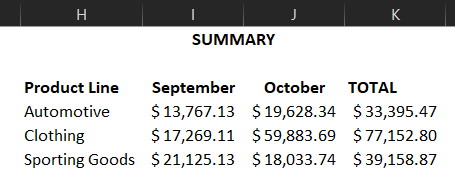
But the thing with summaries like this is that they can raise several questions. Can we trust these numbers? How can we be sure the correct Excel formula is working?
Let’s say that in this scenario, we know that even on bad months that figure is at least $24,000. September is low, and $18,033.74 in October suggests either dreadful sales, a big client dropped us, or the calculations aren’t accurate.
This is definitely something that you’d want to check before meeting with the executives, right? Below is the source data that’s also in the workbook.
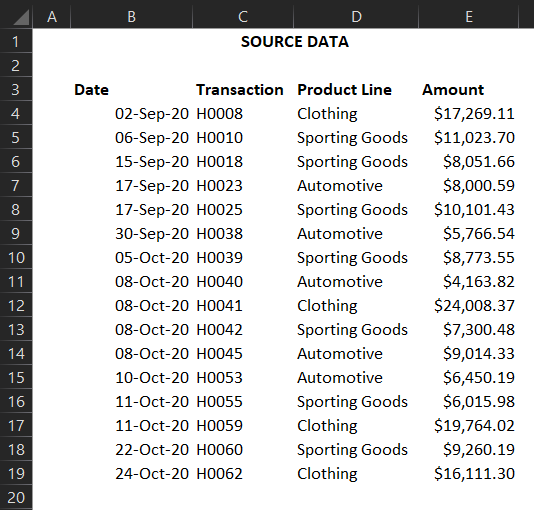
In situations like this, where we have the source data and a summary, good spreadsheet development would include some kind of an alert; i.e., crossfooting, to indicate that the data is sound.
While crossfooting is technically a formal term in accounting, I’m borrowing it to describe calculating the data in at least two ways that should come out equal.
With this data, you can see the crossfooting section within the dashed line.
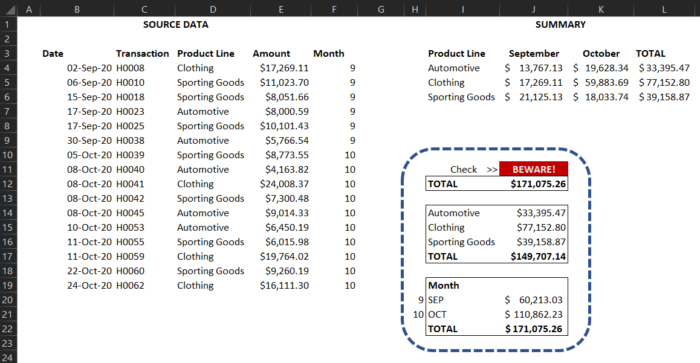
There are several components in this fairly sophisticated alert (Again, our objective isn’t to get into the how-to. The main point is to show why it’s important to have these features in good, reliable Excel files.):
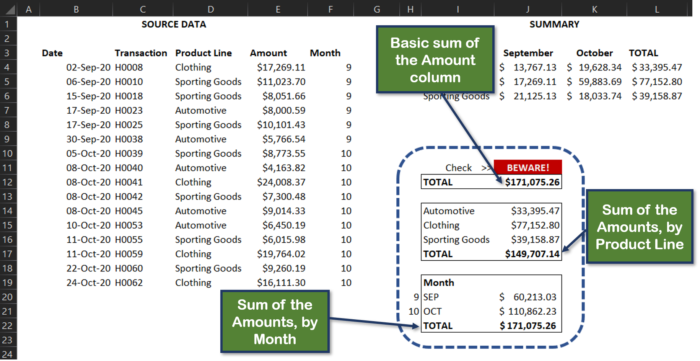
This alert is a quick-glance method of knowing whether or not you can trust the data in the summary.
Question: What can we tell from this specific example?
Answer: we CANNOT trust the summary in I3:L6
Send this data back to whomever compiled it, and have them troubleshoot and repair it until the alert looks like this:
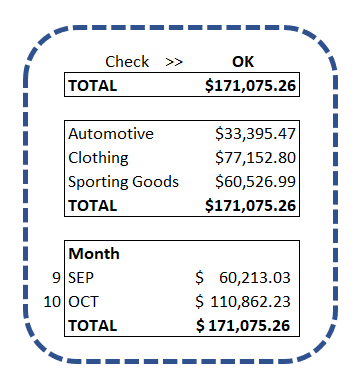
All three values are equal, and the Check value says OK.
Here’s a workbook that includes membership data. Members are in three groups on different sheets: Orange, Crimson, and Purple. We’ve got a nice summary on the Overview sheet.
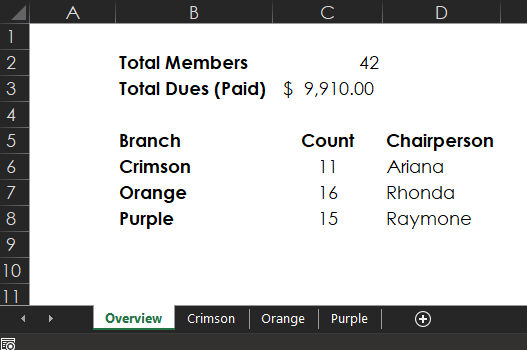
However, there’s a problem. In this scenario, we know that Dakota is the Chairperson of the Crimson group, not Ariana, as shown in cell D6.
However, in D6 there’s a complex formula that’s retrieving Ariana’s name, as noted below.

Knowing exactly what this formula is doing isn’t so important. But at a higher level, notice this: Details!. The exclamation point is Excel’s way of telling us that there is a sheet named Details somewhere in this workbook. But, according to our view in the screenshot above, we only see sheets named: Overview, Crimson, Orange, and Purple.
The Details sheet must be hidden. ?
Here’s how to find it:
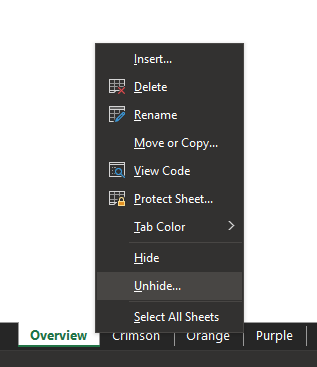
Oh! There’s a Details sheet and an Indigo sheet, both hidden.
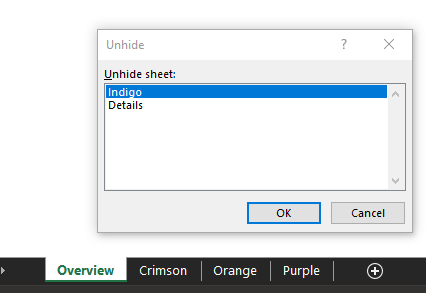
Select Details and OK.
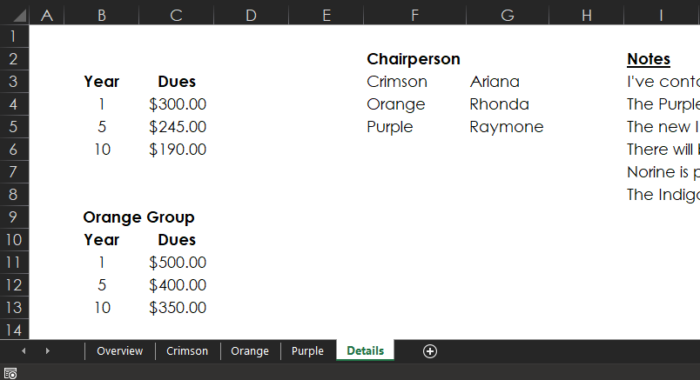
WOW! There’s a lot on this Details sheet, including a separate dues structure for people in the Orange group. And cell G3 is where Dakota’s name should replace Ariana.
You can use hidden sheets for many purposes, including:
If you’re dealing with a workbook that you didn’t create, it’s a good habit to check for any hidden sheets. They may not always be relevant, but it’s a best practice to find out if any exist.
One simple but valuable feature in Excel allows you to see all of the formulas on a sheet, which is a handy trick if you’re troubleshooting why an Excel formula isn’t working. It’s a shortcut to show all formulas in Excel. This helps with troubleshooting when you know that something is wrong or you simply want to review all of the formulas (or check if the person who created the file uses good habits.)
Below, we received the summary of contractors that need to be paid.
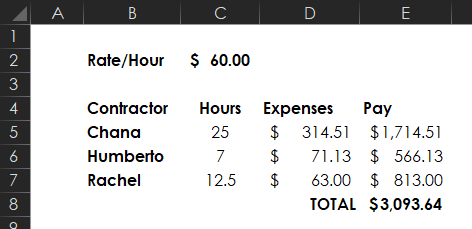
Rather than do the math in our heads to determine if these numbers are accurate, let’s take a quick, high-level peek at the formulas.
Press CTRL+`

And just like that, all of the formulas are revealed. The Hours and Expenses calculations look okay, but the Pay column is strange.
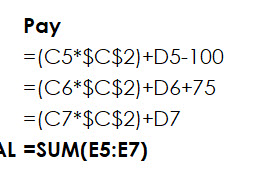
Subtract €100 from Chana, and add €75 to Humberto?
While there might be legitimate reasons for this, the point is that we don’t know what they are. This can cause confusion when it comes to understanding why Excel formulas may not be working correctly. We aren’t sure if these are corrections from previous payments or can be explained some other way. The bottom line, however, is that we need to press CTRL+` to return to the normal view, then contact the person who created the summary and:
And if the adjustments aren’t valid, we’ve got a different problem entirely that likely needs to involve Human Resources.
When it comes to understanding an Excel workbook and diving into data that someone else has analyzed and summarized, there are many tools and techniques to ensure that formulas are working. The ones I’ve highlighted here are quick ways to troubleshoot Excel data, ensure your reporting is as accurate as possible, and pinpoint some of the most common mistakes you (or your team) might be making.
Tell me in the comments: What’s been your biggest data snafu in Excel? How’d you fix it?
Uncertainty is one of the defining traits of the current coronavirus crisis. We still don’t know how this virus works, and our assessment of the future changes by the day. Despite this, one idea is gaining broad consensus: our lives will probably change forever and, thus, so will the way we work. When it comes […]
Overtime is a foggy concept in an age when more than 50% of employees work remotely at least 2.5 days a week. Technology makes it difficult to fully disconnect, and struggling minimum wage workers are eager to take on extra hours. Nevertheless, even if an employee willingly stays late or answers emails on a Sunday […]
Managing a remote team comes with its own unique set of challenges. That’s exactly why we hosted this webinar on how to make remote work part of your team’s DNA, hosted by Laurel Farrer and featuring some of today’s top remote work experts. Watch the recording here, or keep reading to learn more. How to […]