How to report absenteeism KPIs with an executive HR dashboard


Table of Contents
Table of Contents
Absenteeism KPIs are a crucial piece of executive HR dashboards because they shed light on trends and potential issues. Employees miss work from time to time due to different reasons, including being sick or even unplanned absences, and that’s how it should be. It’s unrealistic to expect them to report to work every day of the year. However, if they have a pattern of arriving late or entirely missing pieces, it can negatively impact the company’s productivity. Organizing the company’s daily operations and foreseeing changes that can happen requires knowing your employees and the reasons behind their absences.
Learning how to calculate your company’s absence rate or to be able to measure absenteeism will help you make decisions and create policies that prevent absenteeism in the workplace.
Employee absence rate harms a company’s productivity and can become a significant stress for the HR team. That’s why it makes sense from a business perspective to find a way to track it and a clear indication of making it a KPI.
The absenteeism metric determines the frequency of unexcused or unscheduled absences brought on by illness or other factors. The rate can be calculated for an individual, a group, or the entire organization. The result provides details on individual performance and the overall company’s health. This indicator can help you prepare for potential absences in the future or create a business strategy that prevents them. Additionally, presenteeism, which is part of time and attendance, is a vital metric that companies should consider as the cost is much higher in that case; however, measuring it is challenging.
HR managers can use the average work-hour value to determine the main absenteeism KPI. This will demonstrate the financial impact of absenteeism on the organization. Plus, this makes it easier to develop a budget for a preventative approach.
Excused work absences refer to unexpected absences that are valid and hence likely to be allowed by the employer. They may include personal, or family leave, sudden sickness, or planned short term absences. Absences like these translate into absenteeism once they become extended or repeatedly happen by a person without a good reason.
The best absences in real life are those planned, like holidays, vacations, planned training, planned sick days, or absences like post-surgery recovery or paternity and maternity leave. These are not absenteeism because they are not routine or taken without justification. On the contrary, they are entirely acceptable and less challenging to prepare for. This means they have little impact on productivity as they are part of work life.
Absenteeism is typically described as a pattern of unjustified, repeated absent days or becoming sick often. However, most individuals are unaware that absenteeism also encompasses partial absences like lateness, extended lunches, and early departures. The main problem with absenteeism is that it lacks legitimacy. Therefore, any recurring or protracted absence rate without a valid excuse, whether announced or unannounced, is considered absenteeism.
An executive HR board is a business intelligence tool used by Human Resource teams to track, evaluate, and report on HR KPIs. Including an HR analytics platform in contemporary interactive dashboards makes combining data from many systems easier and enables in-depth data analysis within the dashboard. With this tool, HR teams can gather the information that will help them manage the workplace better. They could improve recruiting, better employee performance and gather accurate knowledge to make better decisions based on the calculated metrics.
HR executives need easy access to all important KPIs in one location to evaluate and analyze data quickly. An excellent executive dashboard should show high-level indicators like employees’ roles and locations and vital metrics related to productivity, training, performance, compensation, absence, and other demographics.
The formula for calculating employee absenteeism is relatively simple. To calculate the percentage of absenteeism over a period, multiply the number of unexcused absences in that period by the total period, and divide the result by 100.
There could always be a possibility to add excused work absences while calculating the absenteeism. However, it is always beneficial to separate these two absences to get more real insights. Considering the available working days would justify the accuracy of the calculation, where we usually deduct the weekends, public holidays, and voluntary days off. The most important thing about calculating the absenteeism rate is how quickly one can identify the patterns and trends that lead to absenteeism. Then, more effectively recognize those patterns and trends using additional absenteeism rate formulas.
So, apart from the absenteeism rate, it’s also important to calculate additional measurements like frequency, the severity of the absences, inactivity rate, or incidence rate. Table 1 shows a few examples. Read more on how to calculate employee absence rates.
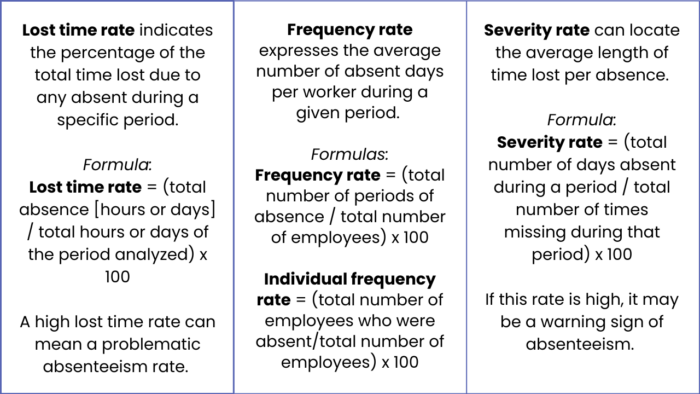
Different departments, teams, or geographical areas must report and assess absenteeism rates. This is a valuable method for identifying areas of excessive absenteeism within the company, which can help develop effective solutions. Metrics like the frequency of absence reporting, working days, the average number of days missed per absence, and zero absences, amongst others, are frequently included in absence reporting.
The average cost of absenteeism in the workplace is very high globally, along with presenteeism. However, it can only sometimes consider the indirect cost that accounts for reduced productivity, low morale, and taking disciplinary actions by management and replacements. The absenteeism cost itself is estimated at around $470 billion in the European Union, according to the European Foundation for the Improvement of Living and Working Conditions. Compared to that, it’s around $225.8 billion in the US, as per The Centers for Disease Control and Prevention (CDC). These high numbers are why absenteeism reporting is so essential for companies today.
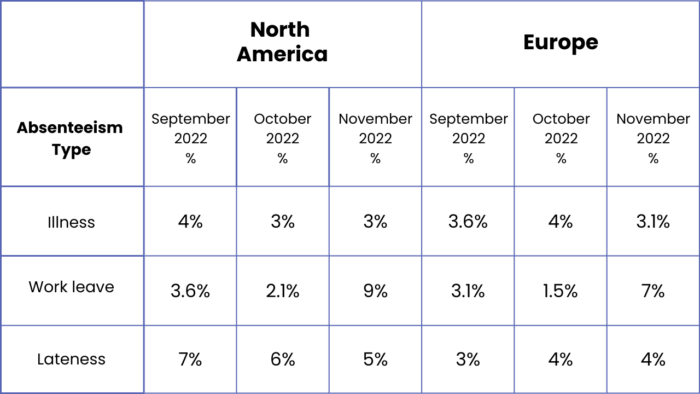
Employers should start with basic reporting in the beginning. As shown in Table 2, consider different geographies or even business units, and follow other benchmarks and best practices to make reporting more effective.
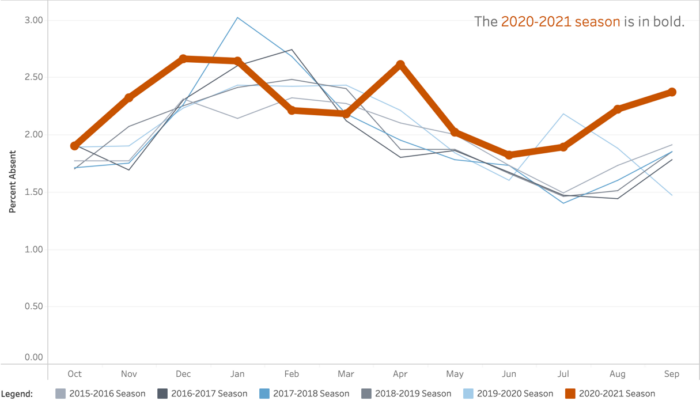
So, what is a reasonable employee absenteeism rate, or what is the low or high rate for employee absenteeism?
The straightforward answers vary, especially if you like to compare the data points available from previous years, as shown in Figure 1. The high and low rates in 2020-2021 are around 2.61% and 1.89%, respectively, much lower than the data five years ago. In 2017-2018 these high and low rates were 3.02% and 1.40%, respectively. This benchmarking helps to understand good absenteeism, especially in current conditions.
Again, these numbers will vary from other regions based on different demographic factors like age, occupation, and industries. For example, the transportation & utilities, wholesale & retail trade, and leisure & hospital industries are among the highest absenteeism rates (3.38%-1.90%). While financial and professional & business services industries have the lowest absenteeism rates (3.28%-1.14%).
Key performance indicators can measure the HR department’s success in accomplishing a goal and help deal with current challenges. They are quantifiable performance measurements that help you understand whether the department or organization is on track because they are tailored to your specific goals and objectives. The KPIs in an HR executive dashboard may differ because it depends on specific goals. For example, if the primary goal is to increase retention, one would want to measure employee satisfaction, voluntary turnover rate, and retention rates per manager. On the other hand, one may focus on the employee absenteeism rate and calculate the absence rate or productivity.
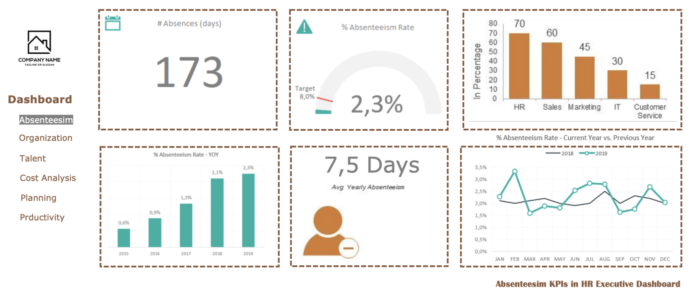
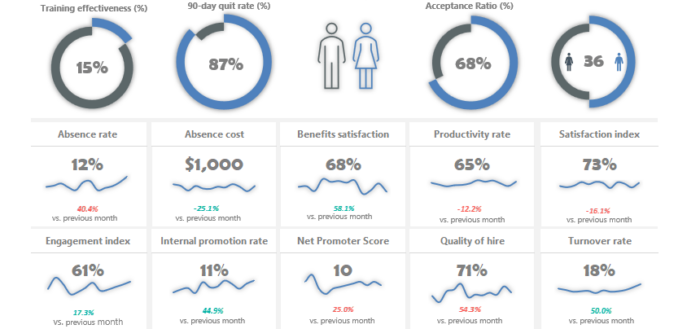
A well-visualized HR executive dashboard must have the option to show KPIs from different areas based on the goals. That’s why it’s essential to define suitable KPIs. For example, Figure 2 shows a few critical absenteeism KPIs from an HR executive dashboard.
The right indicators alone are not enough, mainly if the data is poorly used or not used. This is where data storytelling and visualization are helpful.
Dashboards that concentrate information make it easier to analyze accurate data. This enables you to use the data to construct a story and pinpoint the precise cause of a phenomenon. These HR dashboards make exploring the reasons behind absence easier and help identify the most impacted workers. They are also beneficial in problem-solving and decision-making.
Your dashboard needs to be segmented so that it can be read and understood by everyone.
The dashboard not only allows tracking the primary reason for absences within a specific period, but it also allows tracking the evolution of absence rate over time.
Like Table 1 above, you can quickly determine if a rise in absences is caused by things like maternity leave or workplace accidents. However, the analyses can be more precise, for example, by measuring absenteeism brought on by the illness.
Absenteeism rates according to socio-professional categories can be evaluated using a filter for a specific period. This can rapidly show if managers, employees, or maintenance personnel have the most absences and the reasons why.
The visualization from the dashboard helps HR managers monitor the frequency and severity of absenteeism. The age and other demographics of workers in each socio-professional group can be examined further. Depending on the activity, you may also choose the length (short/long) of absences.
The tool allows stakeholders to see how absenteeism has evolved in the organization over time. They can then assess the impact of policies that address the issue.
Positioning yourself concerning your industry can provide you with a thorough understanding of the state of the market. It can also be an excellent approach to learning what is or isn’t working from your competitors.
When it comes to building an executive HR dashboard, you’ll need to decide what metrics matter most to your team. As proven in this article, absenteeism rates provide insight into your team’s productivity, motivation, and performance.
Here’s a great example of an executive HR dashboard created in Microsoft Excel. This dashboard does a great job at making metrics like absence rate, absence cost, engagement index, and turnover rate easy to gauge at a glance.
You can learn more about this specific dashboard here. Keep in mind there is also plenty of software to choose from when it comes to visualizing data and creating dashboards.
Beebole’s time tracking tool makes it easy to detect absenteeism patterns and their frequency, as well as the employees who are most impacted within the organization, and the severity. As a result, human resources managers can concentrate on putting an action plan into place to address these problems by using this tool to simplify their processes.
Beebole makes it easy to tackle your organization’s absenteeism, thanks to easily customizable settings and reports. For instance, you can define absence quotas, which is where you limit the number of hours an employee can be absent for the same reason.
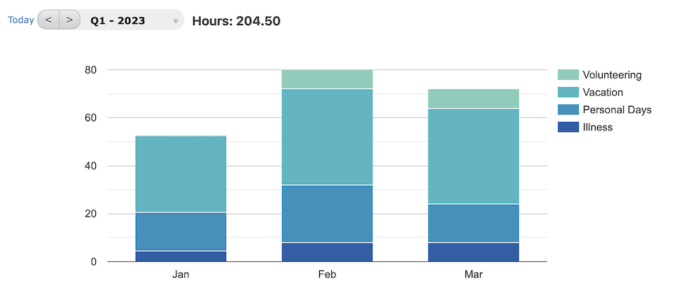
Then, by running a report on absences, you can use a chart to display any historical patterns for absences, both globally and individually.
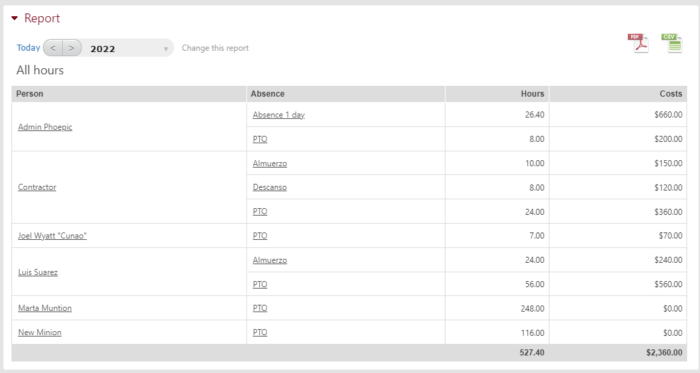
Once you’ve set up costs within Beebole, you can take it one step further, and via Reports or Charts, you can review the actual cost of absenteeism in your company by looking at the type of absence, employee, time of year, and more.
Finally, thanks to Beebole’s Excel add-in and Google Sheets add-on, you can take your data to the next level with more complex calculations like the ration between working time and absence time.
An executive HR dashboard is becoming a vital business intelligence instrument that allows HR teams to follow, analyze and report the entire business on HR KPIs, which helps leaders make decisions to create a better working environment and maximize employee productivity. Therefore, choosing the proper KPIs is significant for the HR team to gain an immersive advantage of using such an executive HR dashboard.
When we consider a healthy and high-productivity working environment, the absenteeism rate could be the most important thing, as it associates with employee engagement and job satisfaction for both full time employees and part time employees. This makes it automatically an important KPI for the executive HR dashboard and can add several benefits. In addition, for any business, absenteeism can reduce profit margins by spending more on overtime pay and contracting workers to deal with absenteeism. The results can get much worse if not measured in the right way.
—
Photo by Roman Bozhko on Unsplash
In today’s rapidly evolving business landscape, organizations face an increasingly complex challenge: how to maintain accurate forecasting and effective risk management while navigating unprecedented levels of uncertainty. As US Economist Michael Hammer wisely noted, “The secret of success is not to predict the future but to create an organization which can prosper in an unpredictable […]
Financial forecasting is the process of making estimates about the future performance of a business or organization. These estimates are based on past performance, current conditions, and trends. Financial forecast reliability is essential for businesses of all sizes. This allows them to make informed decisions about investments, operations, and strategies. What factors affect financial forecast […]
Time tracking for contractors is crucial in today’s gig economy landscape. While staffing your company entirely with independent contractors might sound tempting, it comes with challenges and obligations. The growing distributed economy is increasingly regulated to protect these workers. It’s important to understand the costs, benefits, and obligations of using contractors and freelance workers, particularly […]