

Opening a List view
1
Open the Planning page
Click Planning in the sidebar. Pick the planning you want at the top of the page.
2
Select a List view
Click a List view tab above the task list. To create another one, click Add a view and select List — each view keeps its own columns, sort order, and grouping.
Reading the table
Every task you can see is one row. The header row stays visible while you scroll down. When the columns are wider than the screen, the table scrolls sideways inside its own area and the page itself never scrolls horizontally, while Row #, Task Name, and any column you pin stay on the left (see Pinning columns).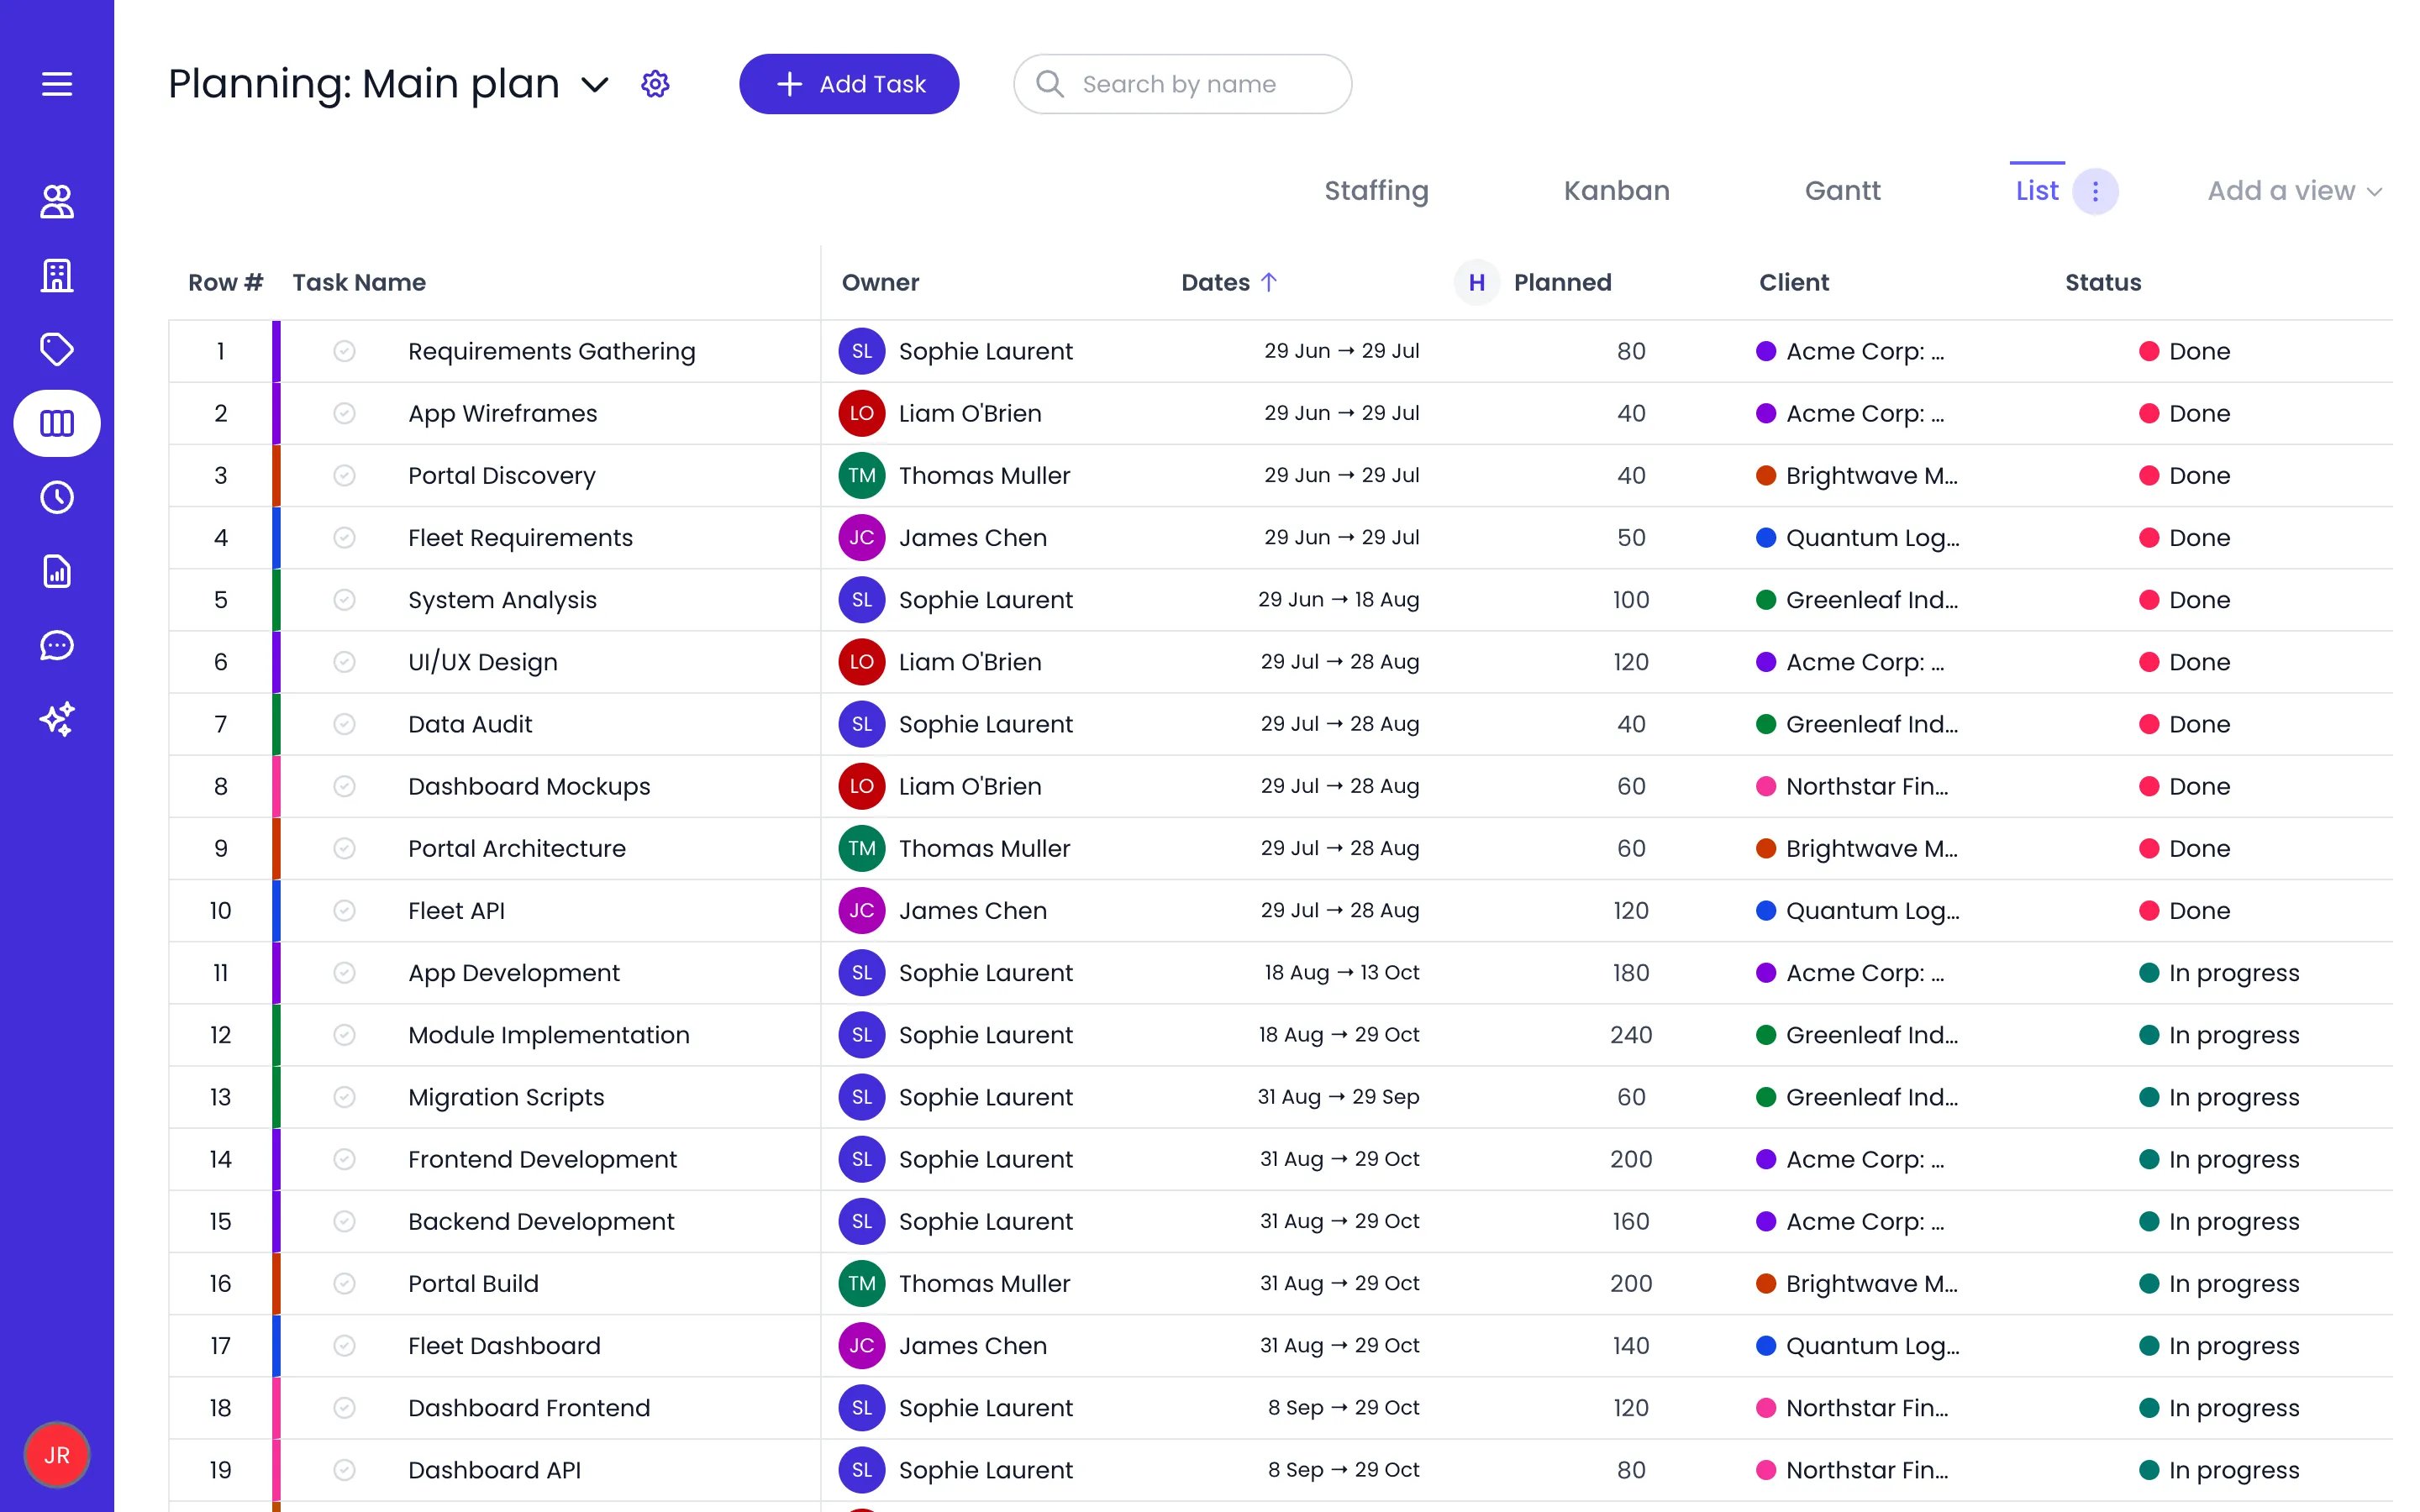
A List view sorted by Dates
- Row # and Task Name are always shown, in that order. A new List view starts with just those two.
- Anything that is a linked item — the owner, the potential owners, the tags, the dependencies, the projects of each category — is drawn as a badge with its ancestors, not as bare text. Click a badge to open it, or Shift+click it to add it as a filter.
- A task with subtasks shows a chevron in its Task Name cell. Click it to reveal the subtasks indented underneath, or hold ⌘ while clicking to expand or collapse every task at the same level at once (the chevron’s tooltip says ⌘+Click for all).
- Subtasks always stay under their parent. Sorting and grouping never separate a child from its parent.
Each List view remembers what you set on it: the columns shown, their order and widths, the sort, the grouping, which parents are expanded, which groups are collapsed, and its filters. Open it again tomorrow and it looks the way you left it.
Choosing columns
Open the ⋯ menu on the active view tab and hover over Columns. Click a column’s name to show or hide it: a tick marks the columns shown. The pin button at the end of each line keeps that column on the left while the table scrolls sideways. Selected columns appear first in the submenu, the rest below in alphabetical order.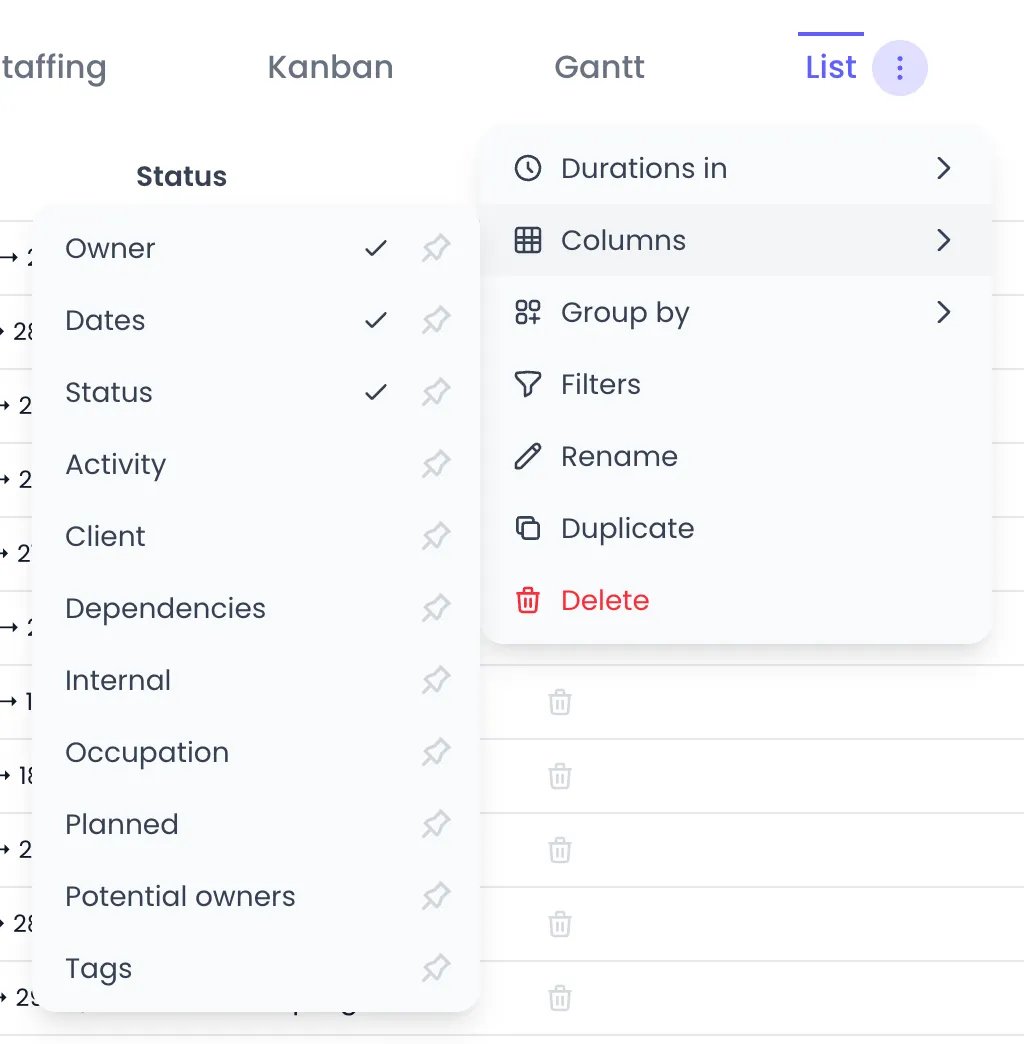
The Columns submenu: the columns shown first, with their tick, then the others, each with its pin button
In addition, one column per project category is available, showing the projects from that category linked to each task.
The Planned figures follow the unit chosen under Durations in in the same menu — Hours or Days.
Pinning columns
Pinned columns stay on the left of the table while the other columns scroll sideways, like frozen columns in a spreadsheet. Row # and Task Name are always pinned. To pin another column, click the pin button next to its name in the Columns submenu (tooltip Keep this column on the left when scrolling), and click it again (Stop keeping this column on the left) to unpin it. Pinning a hidden column also shows it. Pinned columns sit right after Task Name, and hiding a column unpins it.Reordering and resizing columns
- Reorder — Drag a column header sideways and drop it where you want it. Row # and Task Name stay first and can’t be moved. A column dropped among the pinned columns becomes pinned, and a pinned column dropped among the others is unpinned.
- Resize — Drag the right edge of any column header. Widths are saved with the view.
Sorting
Click a column header to sort the table by that column. Click it again to reverse the direction, and a third time to go back to the manual order — a small arrow on the header shows which column is sorted and which way. One column is sorted at a time. The header’s own menu offers the same actions by name: Sort ascending, Sort descending, and Hide column. Sorting applies among siblings: top-level tasks are ordered among themselves, and each parent’s subtasks among themselves, under their parent. With a grouping active, sorting applies inside each group.
Tasks with an empty value in the sorted column sit at the end, whichever direction you choose.
Row # is the row’s position in what you are looking at right now, like a spreadsheet, and dependencies point to those numbers. While a sort is active the row number replaces the drag handle used to reorder rows by hand — click the Row # header (or Manual order in its menu) to get the handles back.
Grouping rows
Open the ⋯ menu on the active view tab and hover over Group by to restructure the list without changing any task data:- Owner — One group per task owner
- Status — One group per status
- A project category — Hover its name and pick one of its levels
- A tag category — Hover its name and pick one of its levels
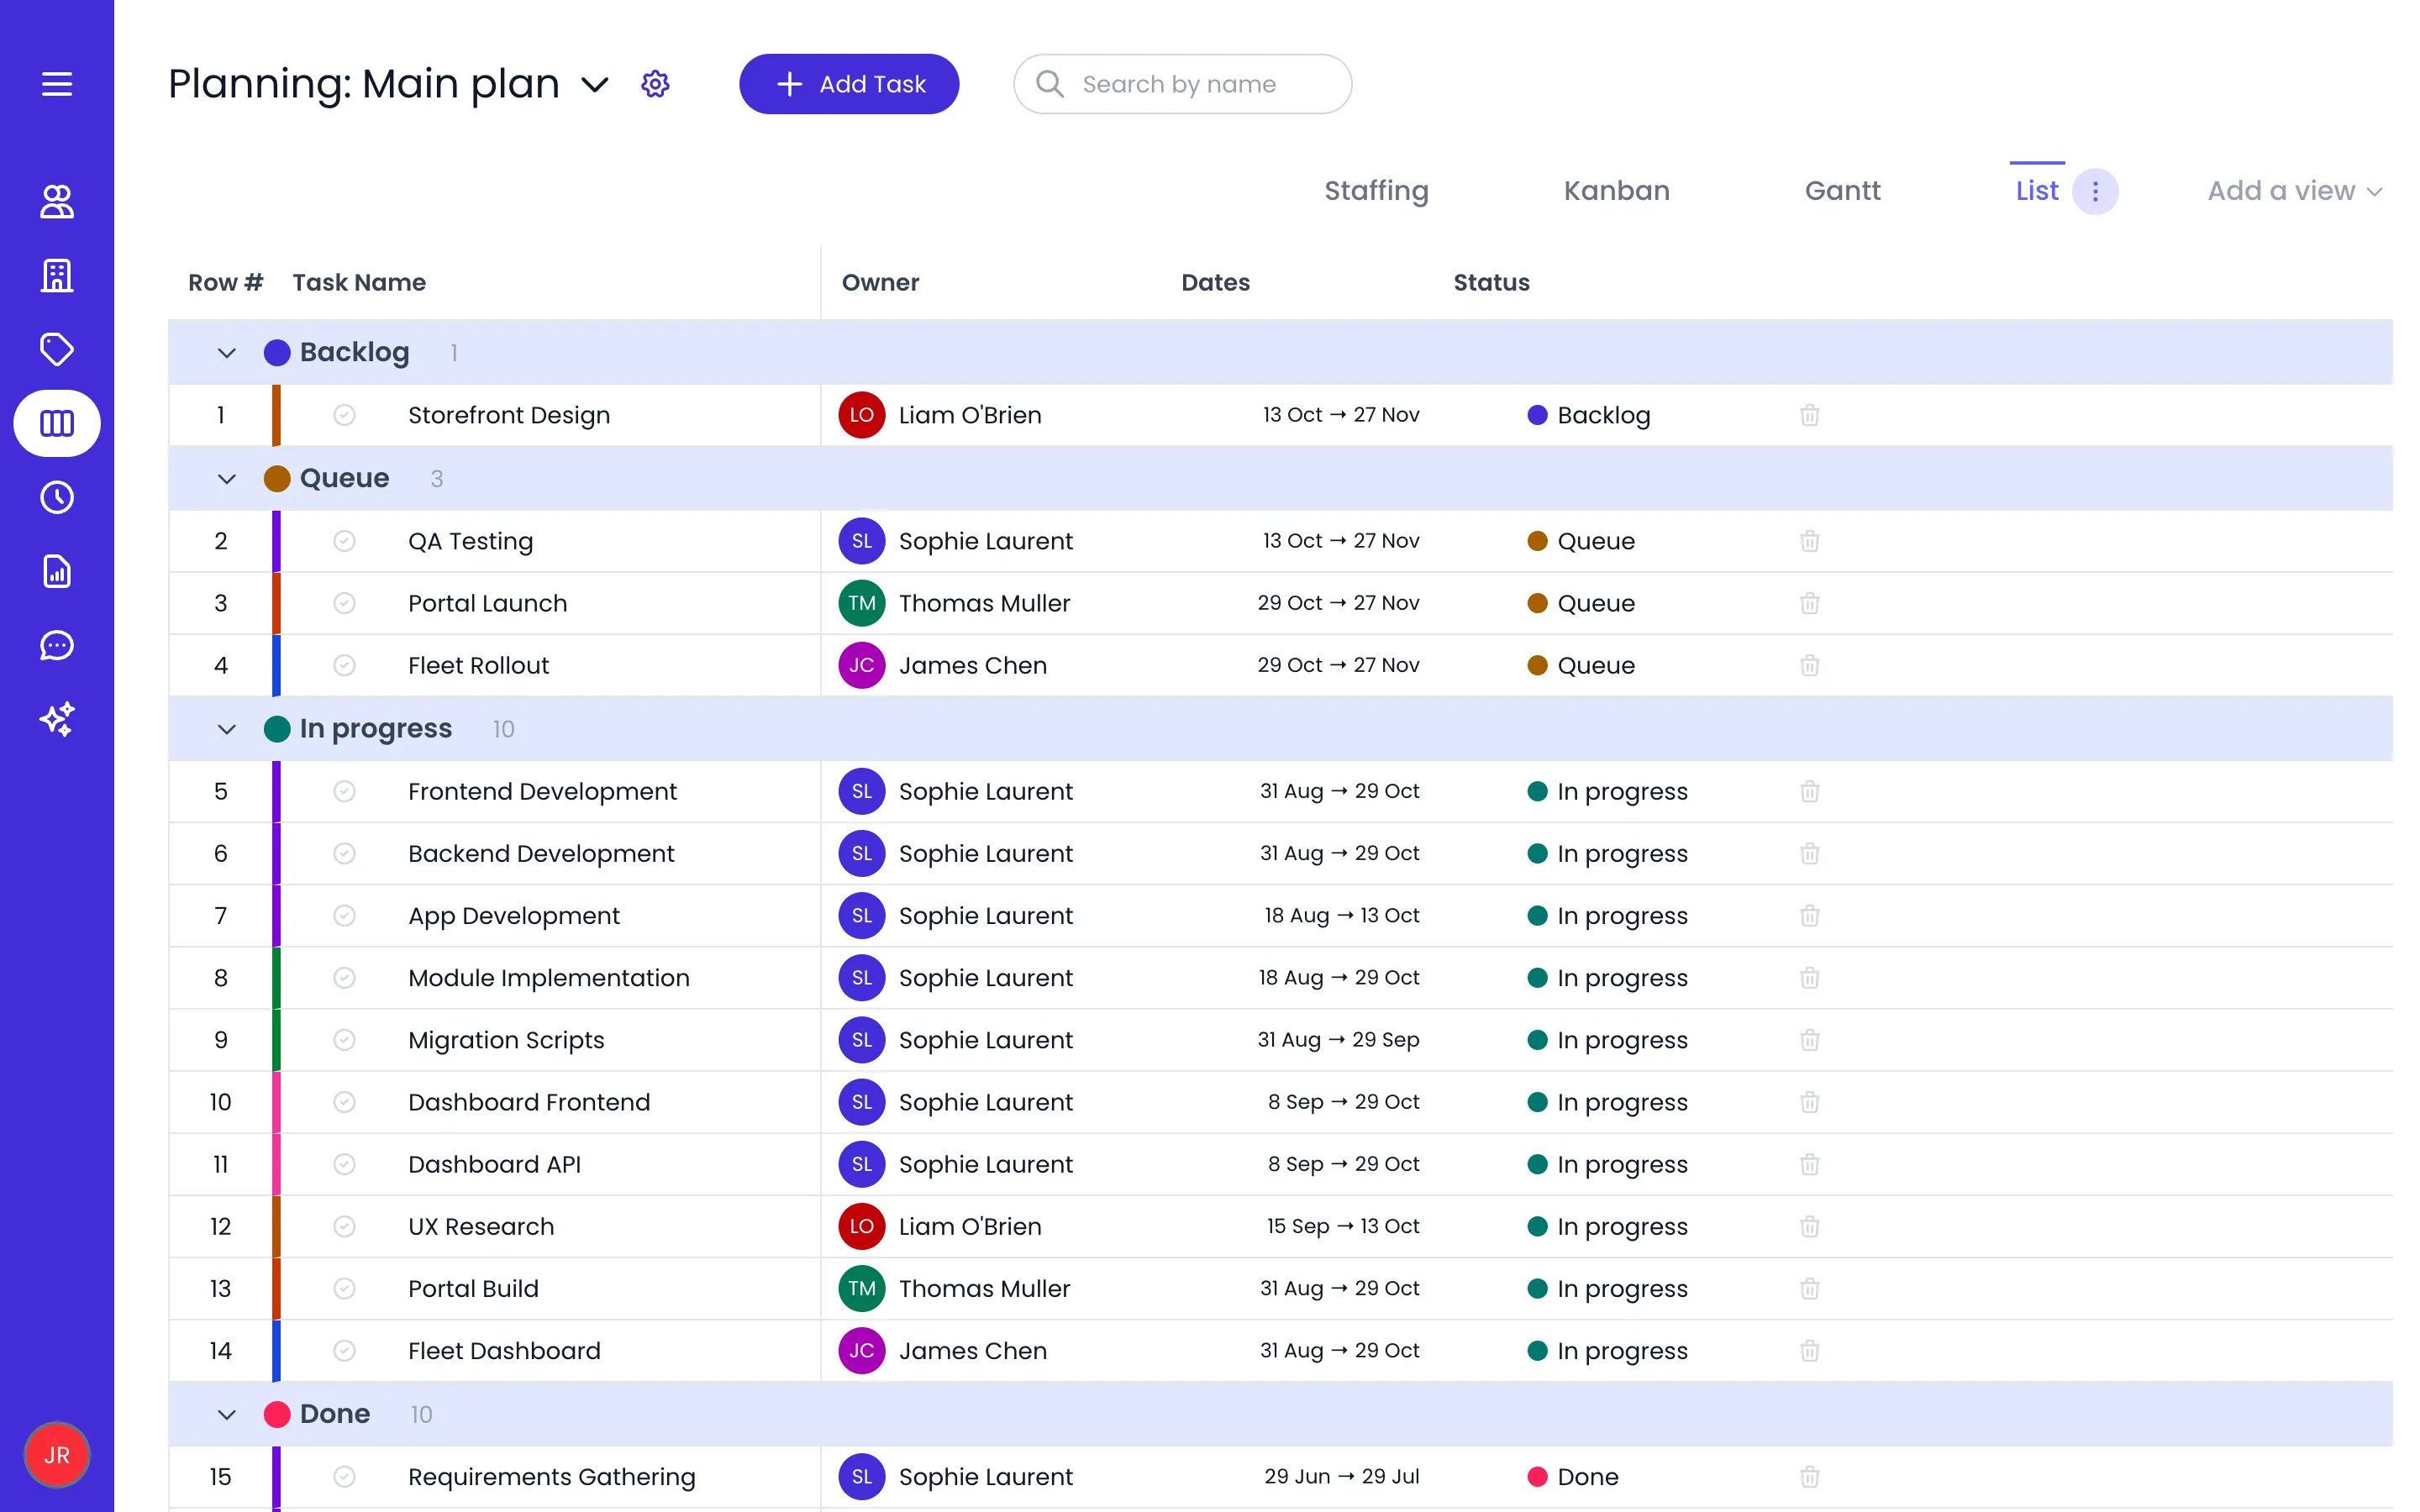
The Main plan List grouped by Status, each header showing the status and its number of tasks
Editing in the table
Every value cell in the List is a control, so you can fill in a whole column without opening a single task.
Changes are saved as you make them. Editing a value never re-sorts the table under your cursor: the new order arrives the next time you click a header or reload the view.
Adding tasks in place
Hover over a row and click the + button next to the task’s name: a name field opens under the row, and what you type becomes a subtask of that task. The + on a group header works the same way at the top of the group, and the new task gets the group’s owner, status, or project. Press Enter to save the task and open a field for the next one, or paste a list to add several at once. Hold ⌘ (Ctrl on Windows) as you click a + to open the full add form instead, with the same values filled in. In a Bookings planning, both buttons open the Add Booking form. See Adding tasks in place for the details.Editing several tasks at once
Build a selection first, then edit any row inside it — the change applies to every selected task:- ⌘+Click (Ctrl+Click on Windows) a row to add it to or remove it from the selection.
- Shift+Click extends the selection to a range.
- Change a value on any selected row and every selected task gets it. Change a row outside the selection and only that row changes.
- Press Esc to clear the selection, or Delete (or Backspace) to delete every selected task.
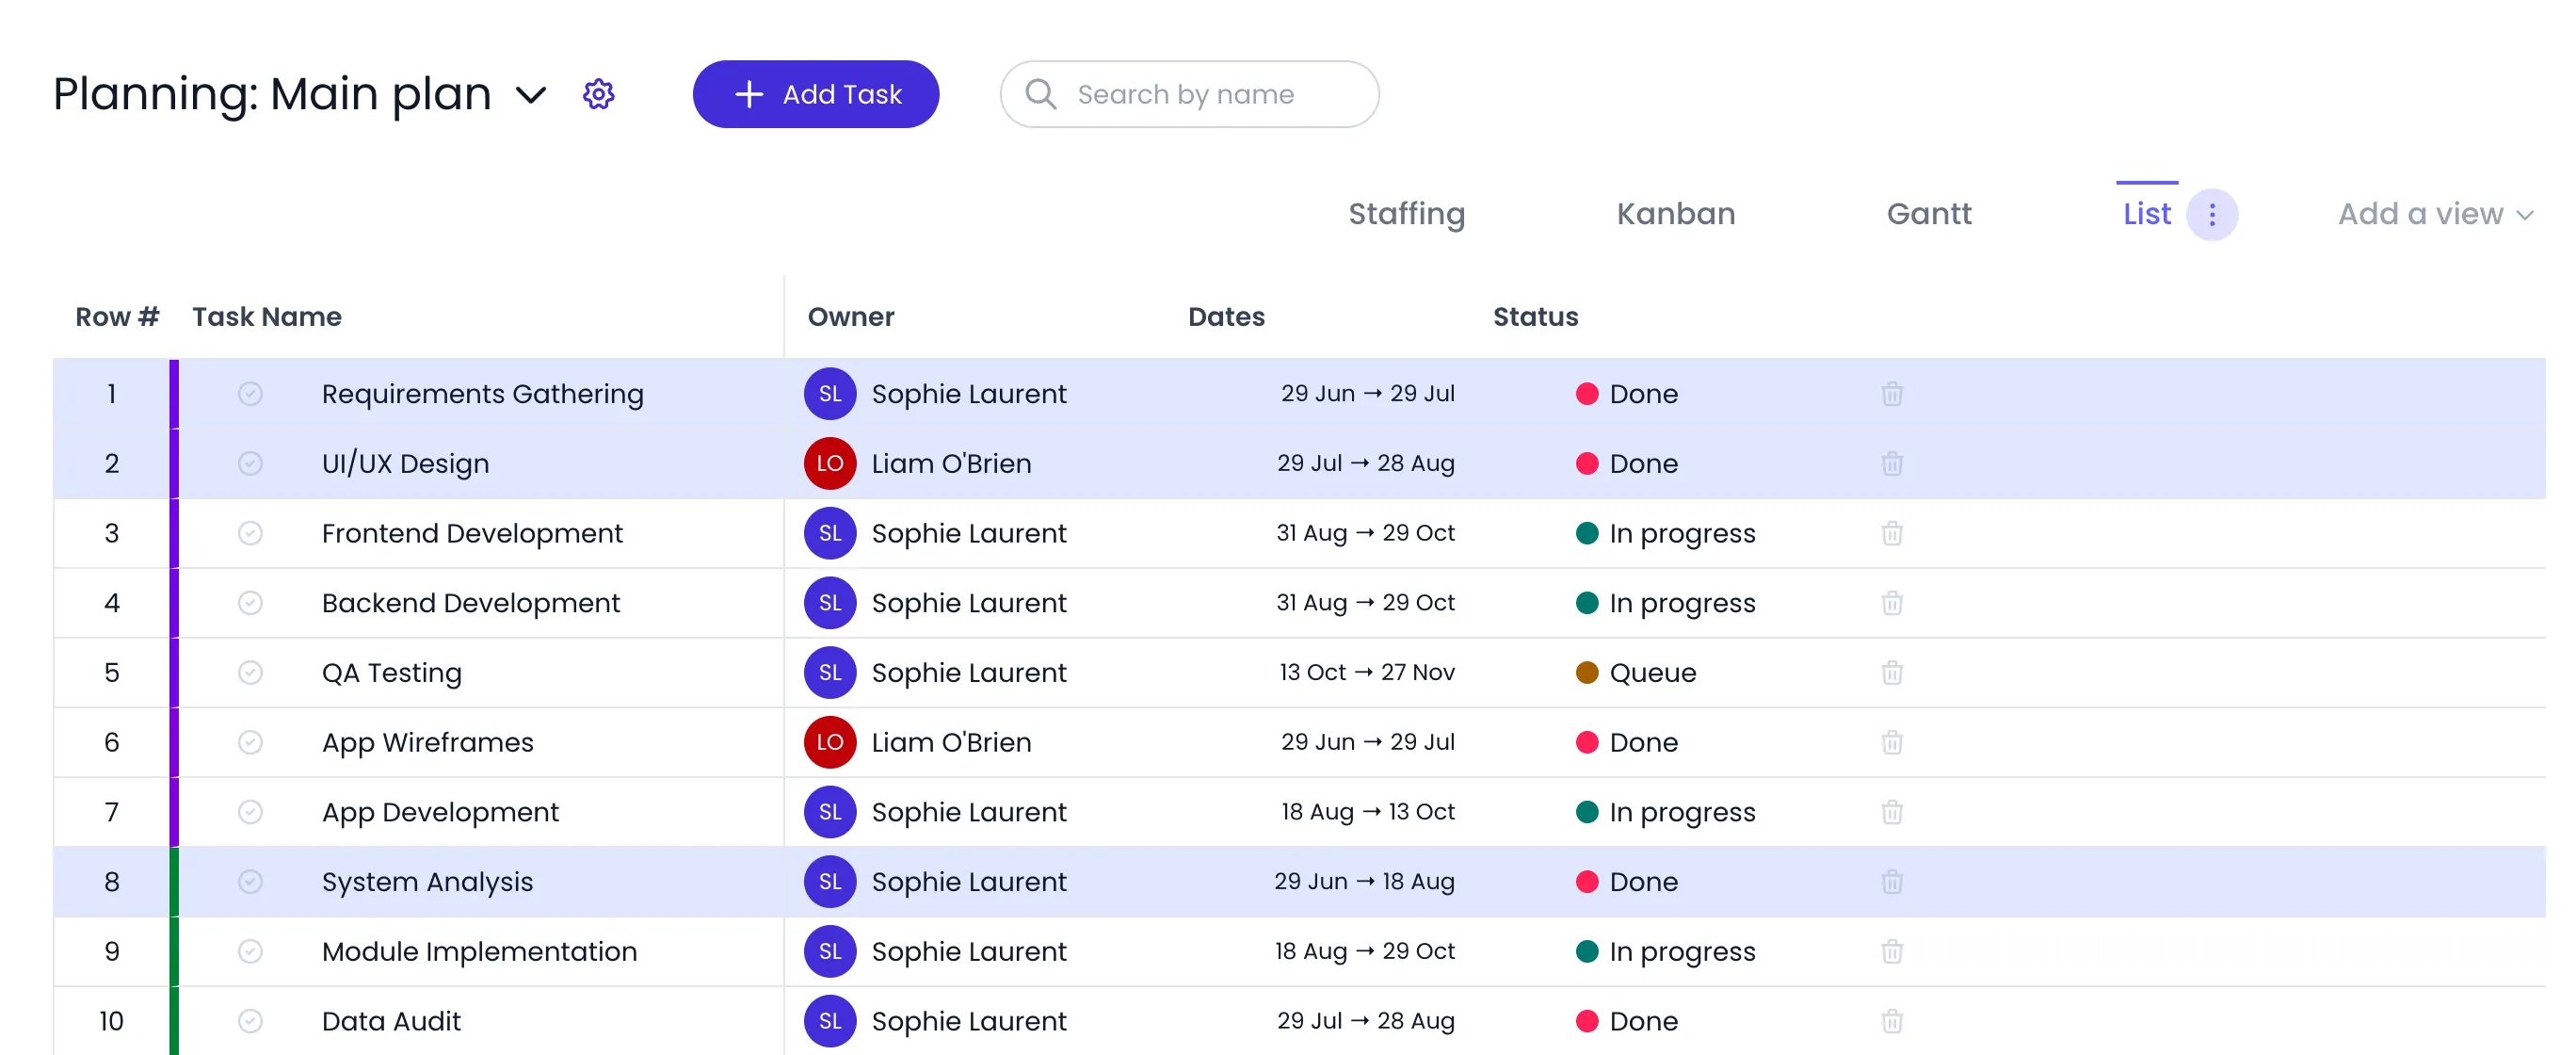
Three tasks selected with ⌘+Click: a change on any of these rows applies to all three
Marking tasks done from a row
If you are allowed to manage tasks, each row carries two icon buttons, which brighten when you hover over the row: one before the task’s name, in the Task Name cell, and one at the end of the row. Their tooltips name them: the first is Done, which marks the task done (on a task already done, the tooltip reads Reopen), and the second is Delete, which deletes it. They do the same as the matching entries of the task’s ⋯ menu. A done task leaves the table until you click Show Done in the page header; see Marking tasks done and deleting them.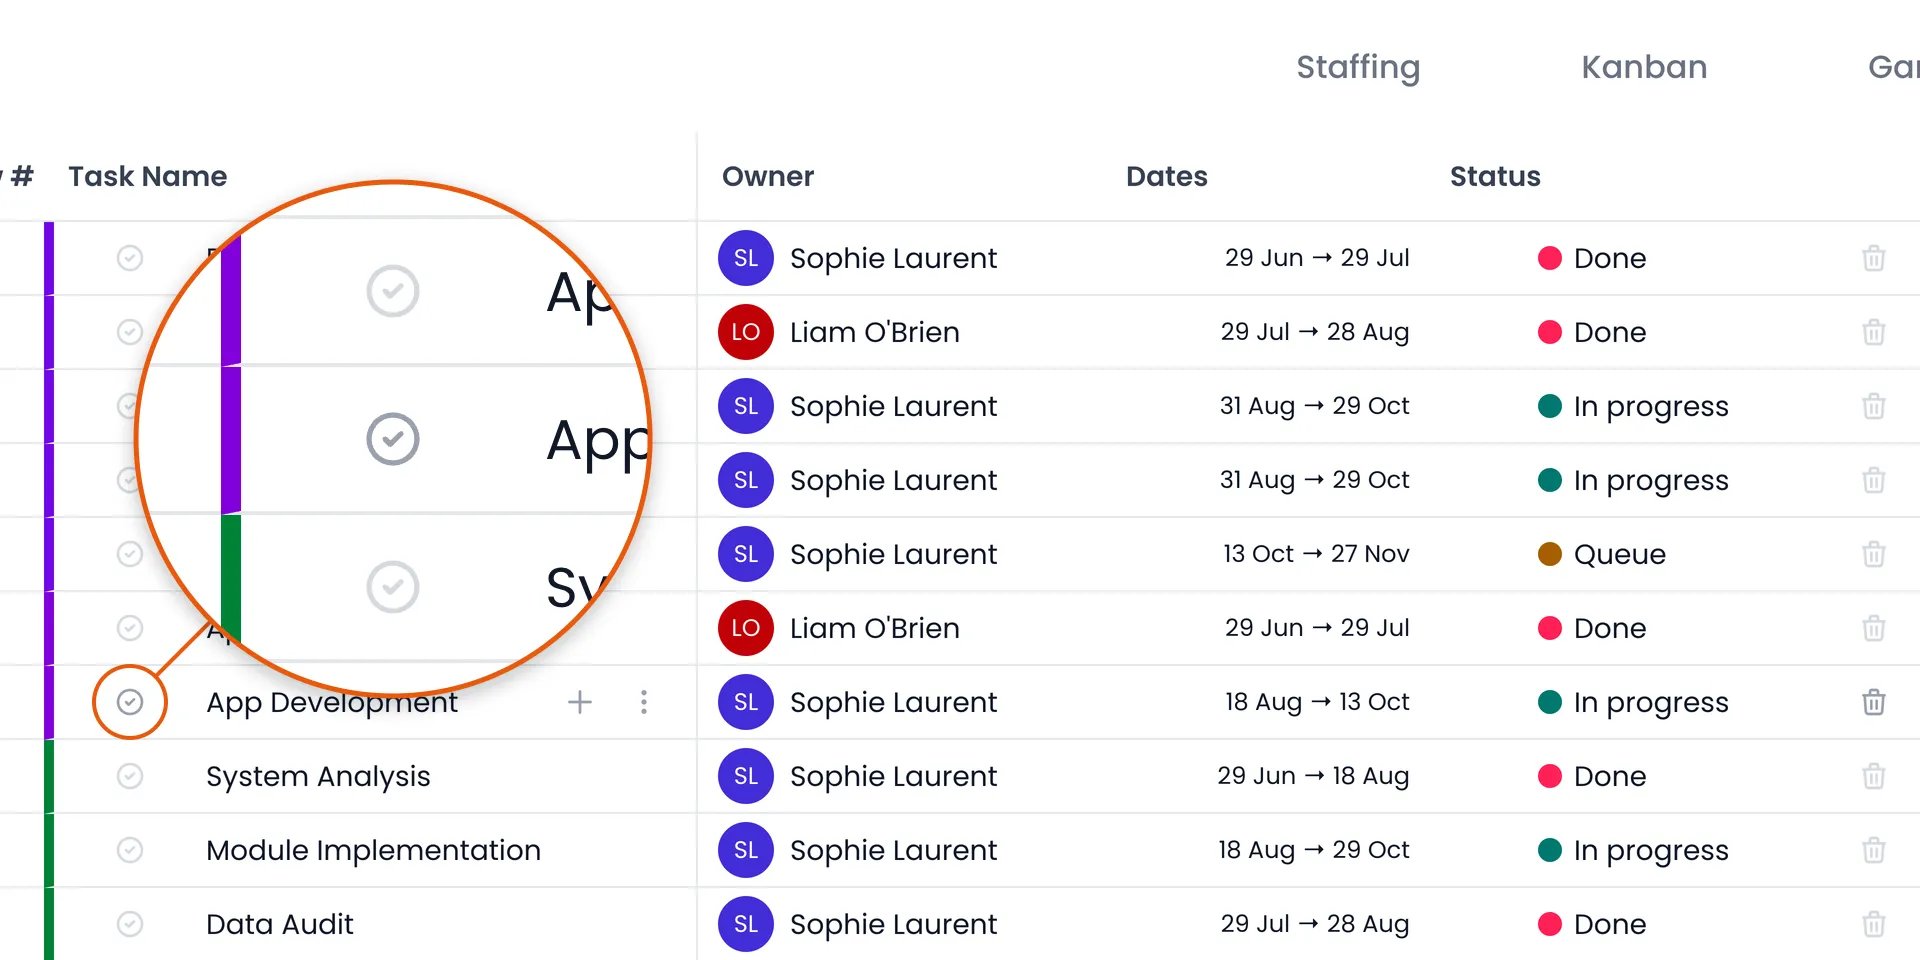
The Done button before a task's name and the Delete button at the end of its row, brighter on the row under the mouse
Filtering and searching
Use the Filters button to narrow the table — by task, status, owner, potential owner, project, or tags — with the active filter count shown on the button. Filters are saved with the view and can be switched off and back on without losing them: the button toggles them rather than clearing them. To search by name, use the task filter’s contains or starts with condition. Shift+clicking any badge in the table adds that item as a filter, which is the fastest way to narrow down to one client, one owner, or one tag.Keyboard navigation
The List responds to the same keys as the Gantt chart:Saved views
The tabs above the task list are saved views, and a planning can hold as many List views as you need — one per way of working the list.- Create — Click Add a view, then List.
- Reorder — Drag a tab sideways and drop it where you want it.
- Rename — Double-click the tab (or long-press it on a touch screen) and type the new name, or use Rename in the tab’s ⋯ menu.
- Duplicate or delete — Use Duplicate and Delete in the ⋯ menu. The last remaining view cannot be deleted.
Related content
Tasks
What tasks are in Beebole — creating, importing, assigning, and tracking time on them.
Gantt chart
The same columns beside a timeline, with dependencies and a workload heatmap.
Kanban board
Move the same tasks through status columns with drag and drop.
Staffing
Book people onto projects on a per-person timeline and balance workload against capacity.
Frequently asked questions
How do I sort my Beebole tasks by date or by owner?
How do I sort my Beebole tasks by date or by owner?
Open a List view and click the Dates or Owner column header. The first click sorts ascending, the second descending, and the third returns the table to the manual order. Sorting happens among siblings, so subtasks stay grouped under their parent.
Can I change the same field on many tasks at once?
Can I change the same field on many tasks at once?
Yes. ⌘+Click rows to build a selection (or Shift+Click for a range), then change the value on any row inside the selection — every selected task in Beebole gets it, as one undo step. Delete removes the whole selection at once.
What is the difference between the List view and the Gantt chart?
What is the difference between the List view and the Gantt chart?
Both show the same tasks with the same columns, which you can sort, reorder, and resize in either view. The Gantt chart pairs those columns with bars on a timeline, for scheduling and dependencies. The List view drops the timeline, gives the columns the whole width, and lets you pin columns so they stay on the left while the table scrolls sideways. That makes it better for finding, checking, and mass-editing tasks.
Why can't I move the Row # and Task Name columns?
Why can't I move the Row # and Task Name columns?
Those two are fixed in Beebole: Row # carries the numbers dependencies point to, and Task Name carries the hierarchy chevron, so both stay at the left of the table and are always pinned there while you scroll sideways. Every other column can be dragged into any order, resized, and pinned.
Can I export the List view?
Can I export the List view?
Not from the view itself — the List view in Beebole is a working table, not an export. Build the figures you need in Reports instead, then download them as Excel, CSV, or PDF.