Table of Contents
Table of Contents
There’s no arguing the importance of having a good handle on your employee cell phone data usage, nor the many pros to issuing devices to employees.
A company-issued cell phone is often a win-win for both employees and businesses. It provides a clear line of division between work and play for employees, and is especially welcome when it comes to device security. After all, many employees aren’t interested in giving their company control over their personal phone to ensure it meets security standards.
And for employers, it’s a no-brainer. Company-issued phones have the potential to create a competitive advantage by controlling the quality of service for devices as well as a standard platform for support and app development. Phone numbers can be retained and passed on to new employees in the same position. Restrictions and security for company information can be enforced and devices wiped remotely if stolen.
–
This article is part of our tutorial series, where—among other things—Microsoft 365 and Google Sheets experts dive into actionable spreadsheet tips you can implement in the office today. Is there something you’d like to know how to do in a spreadsheet? Let us know in the comments below!
_
Using Google Sheets to manage your employee cell phone data usage [Template included!]
Of course, implementing a program like this can be expensive and time consuming for employers. Picking the right plan and equipment can have a large impact on time and cost, and that’s not even mentioning hidden expenses such as already overworked IT resources and workflows that will need to be put in place.
That’s why we’ve put together a Google spreadsheet template for managing your employees’ cell phone data usage. Just as important as something like an automatized employee time tracking system or payroll, this is another big time-saver.
Follow along as we walk you through downloading your cell phone company’s monthly data, integrating it with the template and, finally, analyzing the key takeaways this data holds.
Free template to manage your employee cell data
This article includes a free-to-download wireless plan analysis spreadsheet developed in Google Sheets. Once set up, all you have to do is copy data from your cell phone provider, and the spreadsheet will display the important information in an easy-to-read dashboard. You can share this dashboard with anyone who needs quick insight into the data.
With the template in hand, here’s the data you’ll be able to dive into:
- Compare total charges to the previous month
- See a breakdown of charges by category
- Track data usage by user
- Track minutes used by user
Let’s get started: Download the free dashboard & template
Ready to start down the path toward wireless enlightenment? Here are the steps.
- First, get the example dashboard and ready-to-use template by adding them to your Google Drive.
- Read through this post and follow along with the example Google spreadsheet that’s been filled out with fake cell data.
- Using the template downloaded in step 1, import your own wireless data (which can be downloaded from your cell phone carrier portal) to start managing your own team’s cell phone use.
What to download from the employee phone carrier
You need to download two separate reports from the carrier. Note that these reports are generally .csv or .xls files. The rows are then copied onto the END of the appropriate data sheet.
The first report will consist of a single row of data summarizing the monthly totals for the plan and all users, and should include the following columns:
- Month of Bill
- Total Equipment Charges (device financing payments)
- Monthly Access Charges
- Surcharges and OCC&Cs
- Taxes, Surcharges and Fees
- Usage and Purchase Charges
- Total Current Charges

The second report, with individual user data, will contain a row for each user. These are the columns to include in that report:
- Name
- Phone Number
- Billing Cycle Date
- Used Minutes
- Data Usage
- Equipment Charge (typically a financing payment for the device)
- Total Current Charge (all the line charges for the month)
- Upgrade Eligibility (optional)
- Phone Model and Manufacturer (optional)
- Line Activation Date (optional)

You’ll see we’ve listed a few optional items above. If you want to add more functionality to this dashboard down the road, it’s a good idea to pull that data now so it’s there for you to use in the future. (Speaking of which, if you’d like to learn how to add a sheet to show the latest stats of all the current users with the ability to sort by multiple categories, let us know! We’re all ears when it comes to suggestions for this new series on spreadsheet quick wins.)
The Google template spreadsheet contains a sheet for the overall plan data and a sheet for the individual user data. This is where you’ll copy your own data to start analyzing your employees’ cell phone usage.
Let’s set up the employee mobile data analyzer
Once you’ve downloaded the data from your provider, the next step is to copy it into the spreadsheet.
Monthly charges tab
Copy the monthly data from the single-line monthly report into the tab called “Monthly Charges.” Remember, the first time you input data will be the only time you also need to copy the headers to this spreadsheet. For all subsequent months, you’ll only need to copy the data.
User data tab
Now, copy the report with data broken down by user into the “User Data” tab, once again remembering that this first month is the only month you’ll also need to copy the headers, too.
Note
When you set up the data you want to download in the report from your carrier, be sure not to change the report moving forward. If you edit the data downloaded in the report, be sure to adjust the worksheet if necessary.
Once you have a format to download the data in, it cannot change moving forward. Each month, you’ll copy the data at the bottom of the previous month’s data without any separating rows. Be sure to back up the data files from the carrier in a folder for future reference—you never know when it might come in handy!
Which column is which?
In order to unleash the full power of the spreadsheet, it needs to know which columns have which data. The “Worksheet” tab is where all the calculations are done. You only need to fill out the green-colored cells with the column letters from the corresponding sheet representing that data.
In each of the green cells, the letter of the column holding that data needs to be filled in. Have a look at the example spreadsheet to see it in action. Note which section has letters for the monthly data and which has letters for the user data.
The rest of the “Worksheet” tab is dedicated to calculations displayed on the dashboard. In fact, you can right-click on the “Worksheet” tab to hide the sheet because you won’t need to access it moving forward. If you need to, the sheet can by un-hidden from the “View” menu option “Hidden Sheets.”

The dashboard

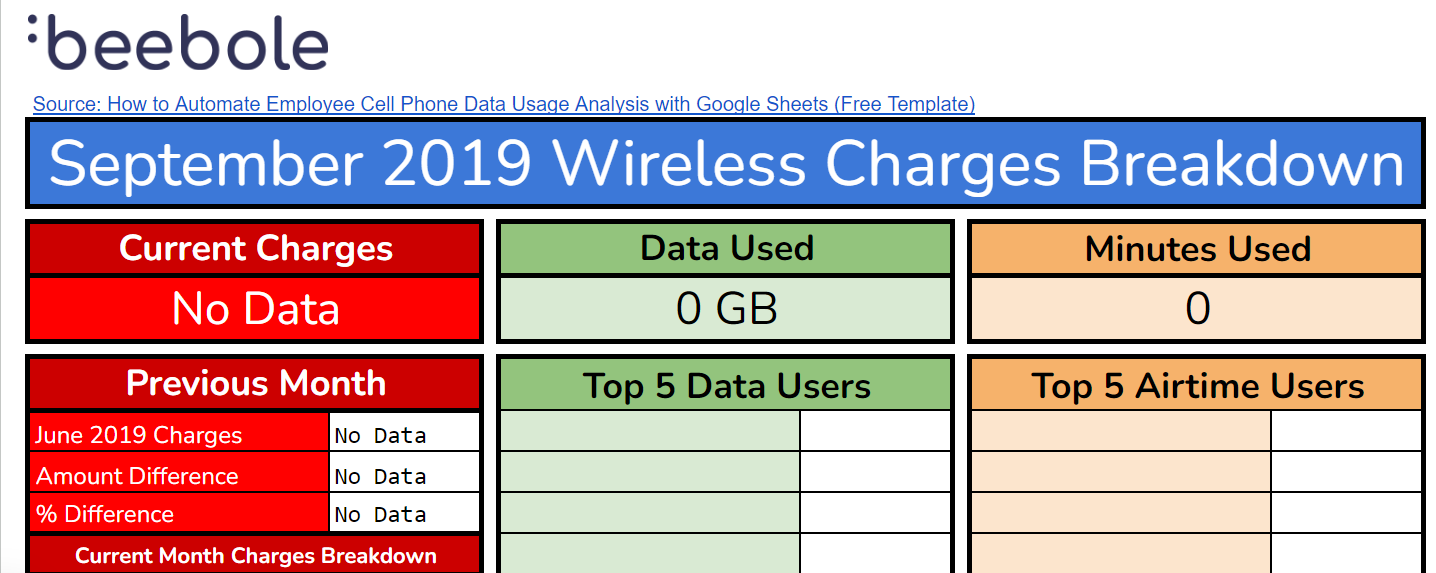
Finally, it’s time to go over the dashboard. You’ll see the “Dashboard” tab is first, and that’s where all the magic happens. This is where the results from the data calculations will be displayed. Once your initial data is populated and the “Worksheet” tab is filled in with the column letters, the dashboard will fill in with the calculation results. When you add data each month, the dashboard will update automatically.
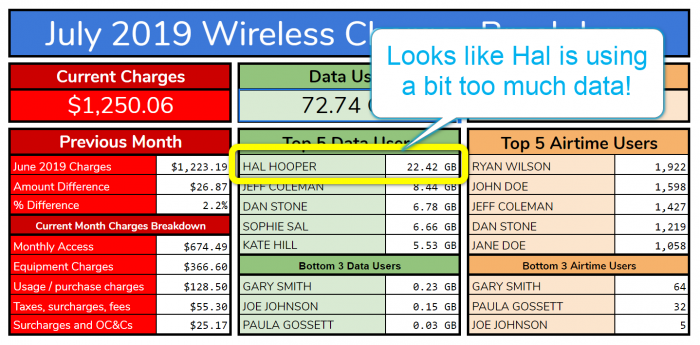
The title of the dashboard changes depending on the month. Charges are displayed for the current and previous month. For data usage, the total amount used is shown, as well as the top five users. The three users who used the least amount of data are also displayed. The same format is used to display minutes used as well.
Employee cell phone data usage: The insights
Now we can dive into the good stuff. It’s very easy to just pay the cell bill every month without noticing increasing costs and the reason for them, which is exactly why we’ve created this template. This cell data dashboard is a powerful tool in gaining insight and helping you see costs before they escalate with very little effort on your end. When it comes to analyzing the true cost of an employee, this type of information is vital, and even better once automatized.
Here are the key questions to ask yourself to make smarter decisions with your team’s cell phone plan as you analyze your employee cell phone data usage.
Did my costs increase from last month?
The biggest piece of data to keep tabs on is the total bill. Being able to quickly see a jump in costs leads to questions like:
- Did we add new lines?
- Did we buy new equipment?
- Were there charges for data overages?
- Is someone on the team abusing their cell plan?
How much did I spend by category?
The charges are broken down into access, equipment and various fees showing at-a-glance just how much is spent in each category without having to dig through your monthly bill. Nothing like easy-to-access data, is there?
How much phone data did my team use?
Cell phone data usage is important to keep track of because a single employee can cause those costs to rise in a hurry. The dashboard shows the top five users, as well as highlights whether they’re using a significant amount of data. Consider coaching those who are using too much data to limit their usage or even adjusting your budget for more data in the future.
How many minutes has each employee used?
Despite cell phone minutes being unlimited these days, you can still glean insight from this data. The number of minutes used could correlate to higher performers in the organization (depending on their position). On the other hand, pinpointing users who use a minimum amount of minutes and/or data may be an opportunity to save money by removing them from the plan.

Because collaboration is at the heart of the G Suite applications, you can share this sheet with anybody on the team. You can even embed and bookmark the dashboard itself in a web page. See this Google support link for more info on publishing and embedding.
Using spreadsheets to automate control of employee mobile data
Setting up a spreadsheet like this takes a bit of time on the front end, but once it’s set up, it’s a total time (and money!) saver. Tracking data like this in Google Sheets is smart because it’s an application everybody in your company already has and probably uses at least a little bit. No extra licenses, installation or training is needed, and the data speaks for itself. With this dashboard in hand, take the guesswork out of employee cell usage with data-backed facts to inform your decisions.
If you liked this post, be sure not to miss 5 formulas every HR professional should know how to use in Google Sheets, as well as this tutorial on taking your reporting to the next level in Google Sheets.
Next steps
Don’t forget Beebole’s own Google Sheets add-on, the perfect tool to take your reporting to the next level with crucial employee data like projected vs. actual project timelines, budgets and much more. Install it here.


Good Afternoon,
I am unable to download the dashboard and spreadsheet. Could you let me know if this is still free and available to download?
Thanks,
Hi Melissa,
Thanks so much for reading and commenting. They are both available to download still by clicking the links in the article. Make sure you don’t have pop-ups blocked as a new window will open asking if you’d like to make a copy of both. Please let us know if you have any further issues.